Fleet Route Performance Metrics: Essential KPIs for Optimizing Delivery Operations
How to start saving money
Lorem ipsum dolor sit amet, consectetur adipiscing elit lobortis arcu enim urna adipiscing praesent velit viverra sit semper lorem eu cursus vel hendrerit elementum morbi curabitur etiam nibh justo, lorem aliquet donec sed sit mi dignissim at ante massa mattis.
- Neque sodales ut etiam sit amet nisl purus non tellus orci ac auctor
- Adipiscing elit ut aliquam purus sit amet viverra suspendisse potent
- Mauris commodo quis imperdiet massa tincidunt nunc pulvinar
- Excepteur sint occaecat cupidatat non proident sunt in culpa qui officia
Why it is important to start saving
Vitae congue eu consequat ac felis placerat vestibulum lectus mauris ultrices cursus sit amet dictum sit amet justo donec enim diam porttitor lacus luctus accumsan tortor posuere praesent tristique magna sit amet purus gravida quis blandit turpis.

How much money should I save?
At risus viverra adipiscing at in tellus integer feugiat nisl pretium fusce id velit ut tortor sagittis orci a scelerisque purus semper eget at lectus urna duis convallis. porta nibh venenatis cras sed felis eget neque laoreet suspendisse interdum consectetur libero id faucibus nisl donec pretium vulputate sapien nec sagittis aliquam nunc lobortis mattis aliquam faucibus purus in.
- Neque sodales ut etiam sit amet nisl purus non tellus orci ac auctor
- Adipiscing elit ut aliquam purus sit amet viverra suspendisse potenti
- Mauris commodo quis imperdiet massa tincidunt nunc pulvinar
- Adipiscing elit ut aliquam purus sit amet viverra suspendisse potenti
What percentege of my income should go to savings?
Nisi quis eleifend quam adipiscing vitae aliquet bibendum enim facilisis gravida neque. Velit euismod in pellentesque massa placerat volutpat lacus laoreet non curabitur gravida odio aenean sed adipiscing diam donec adipiscing tristique risus. amet est placerat in egestas erat imperdiet sed euismod nisi.
“Nisi quis eleifend quam adipiscing vitae aliquet bibendum enim facilisis gravida neque velit euismod in pellentesque”
Do you have any comments? Share them with us on social media
Eget lorem dolor sed viverra ipsum nunc aliquet bibendum felis donec et odio pellentesque diam volutpat commodo sed egestas aliquam sem fringilla ut morbi tincidunt augue interdum velit euismod eu tincidunt tortor aliquam nulla facilisi aenean sed adipiscing diam donec adipiscing ut lectus arcu bibendum at varius vel pharetra nibh venenatis cras sed felis eget.
Fleet route performance metrics show if your vehicles are running efficiently, on time, and within budget. These metrics help fleet managers spot delays, cut extra mileage, and improve service quality.
Without tracking the right metrics, fleets can miss chances to lower costs and boost performance.

Measuring route performance means monitoring specific KPIs like financial results, operational efficiency, driver behavior, and vehicle use. Each metric gives insights into route planning and execution.
Cost per mile shows spending patterns. On-time delivery rates reflect customer service levels.
This guide covers the key metrics for fleet route optimization. The next sections explain KPIs for cost management, asset use, maintenance, safety, technology, and environmental impact.
Core Fleet Route Performance Metrics

Fleet managers need clear data to check routing and costs. The four metrics below give useful insights into fuel use, asset use, customer satisfaction, and route quality.
Cost Per Mile (CPM)
Cost per mile is the total expenses divided by miles traveled. This metric includes fuel, maintenance, insurance, driver wages, and vehicle depreciation.
To calculate CPM, track all costs over a set time and divide by total miles driven. Fleet managers often check this metric monthly or quarterly.
Key parts of CPM:
- Fuel use and price changes
- Scheduled and unscheduled maintenance
- Driver pay, including overtime
- Insurance and registration
- Tire replacement
A rising CPM can mean problems with planning, vehicle health, or driver habits. Comparing CPM to industry averages helps managers see if their fleet is efficient.
Total Cost of Ownership (TCO)
Total cost of ownership covers all expenses from buying to selling a vehicle. This includes the purchase price, financing, running costs, and resale value.
TCO analysis helps decide when to replace vehicles and which ones to buy. A cheaper vehicle may cost more to maintain over time.
- Purchase or lease price
- Financing costs
- Fuel over the vehicle’s life
- Maintenance and repairs
- Downtime from breakdowns
- Resale value
Tracking TCO for different vehicles shows which ones offer the best value. This helps plan fleet renewal and growth.
On-Time Delivery Rate
On-time delivery rate is the percentage of shipments or service calls finished within promised time windows. This metric shows customer satisfaction and reliability.
Calculate this by dividing on-time deliveries by total deliveries. Even small increases in this rate can improve customer relationships.
Good route planning improves delivery times. Factors like traffic, loading, and driver skills affect punctuality.
GPS tracking and route software give live updates on delivery progress. These tools help spot delays and adjust routes as needed.
Route Efficiency
Route efficiency checks if vehicles complete routes with minimal wasted miles and time. It compares the actual distance to the best possible route.
Efficiency signs include:
- Miles per delivery or stop
- Fuel used per route
- Time spent driving vs. idling
- Deviations from planned routes
- Number of stops per shift
High route efficiency cuts fuel costs and lets drivers make more deliveries. Fleet management systems use past data to improve routing.
Managers should review routes with low efficiency. Causes may include poor planning, driver habits, or unrealistic schedules.
Financial and Cost Metrics

Tracking financial results means watching fuel costs, operating costs, and vehicle values. These metrics affect profit and guide decisions on routes and assets.
Fuel Costs and Consumption
Fuel costs make up about 24-28% of total fleet expenses. Managers should track both cost per gallon and miles per gallon for each vehicle and the whole fleet.
Fuel cards give detailed data to spot unauthorized purchases and odd fuel use. This information links with fuel management systems to track spending by vehicle, driver, route, and time.
Compare actual fuel use to benchmarks for similar vehicles and routes. Large differences may signal issues like poor routing, too much idling, aggressive driving, or mechanical problems.
Operating Costs
Cost per mile is a key metric, found by dividing total expenses by miles traveled. This includes fuel, repairs, insurance, driver pay, and admin costs.
Fleet systems track cost per vehicle to spot high-cost units. Breaking down costs shows if problems come from repairs, fuel use, or other areas.
Total cost of ownership (TCO) includes buying, running, and depreciation over a vehicle’s life. This helps compare vehicles and decide when to replace them based on performance.
Vehicle Replacement and Resale Value
Vehicle replacement depends on repair costs, downtime, and resale value. Vehicles that cost more to repair than they are worth should be replaced.
Tracking resale value helps managers understand how fast different vehicles lose value. This guides buying and replacement schedules.
Metrics should include average holding periods and resale values at disposal. Keeping good service records and fixing cosmetic issues can increase resale value by 10-15%.
Utilization Metrics
Utilization metrics show how well vehicles are used during available time. These numbers help spot underused vehicles, too much idling, and ways to adjust fleet size.
Vehicle Utilization Rate
Vehicle utilization rate is the percentage of time a vehicle is in use compared to its total available time. Calculate it by dividing operating hours by available hours, then multiply by 100.
For example, a vehicle used 12 out of 24 hours has a 50% rate. Most fleets aim for 60-85%, but this varies by industry.
This metric gives detailed insights into each vehicle. Tracking it helps decide on buying, selling, or moving vehicles.
Low utilization often means the fleet could be smaller or vehicles could be reassigned.
Fleet Utilization
Fleet utilization looks at all vehicles as a group. It measures total operating hours against total available hours for the whole fleet.
This uses both miles traveled and hours in service. Managers track both to see overall patterns.
Key parts:
- Total miles for all vehicles
- Total operating hours
- Percentage of vehicles in use
- Capacity used compared to potential
Fleet utilization shows if there are too many or too few vehicles. The goal is to have the right number, type, and location of vehicles when needed.
Idle Time and Idle Reduction
Idle time is when vehicles are running but not working. Measure idle time as total minutes or hours per day, then as a percentage of total operating hours.
Too much idling wastes fuel, raises repair costs, and shortens vehicle life. For example, one hour idling in an eight-hour day is 12.5% idle time.
Telematics systems track idle events and send alerts if limits are passed. Managers set idle targets and use strategies like driver training and route planning to cut idle time.
Cutting idle time improves efficiency and lowers fuel use. Many fleets cut idle time by 15-30% with regular tracking and action.
Maintenance and Downtime Metrics
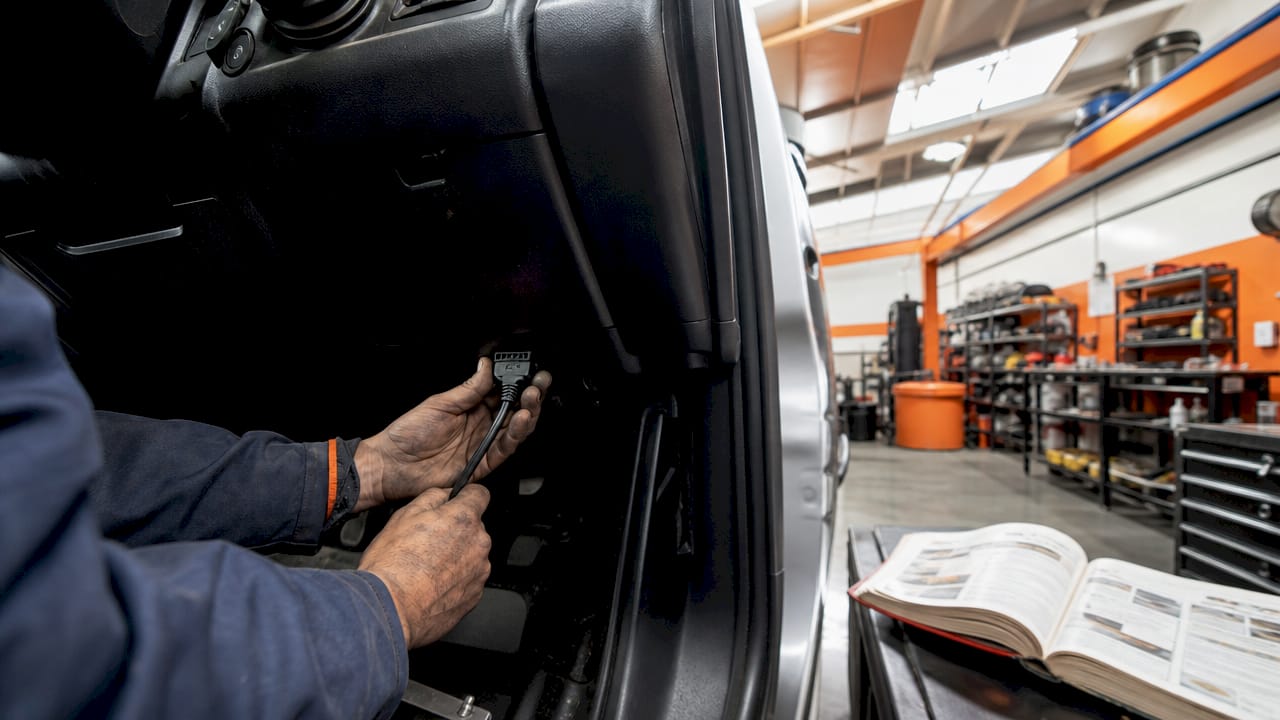
Maintenance metrics affect route performance by showing how often vehicles are ready and how quickly they return after repairs. Tracking PM compliance, failure rates, and repair times helps reduce breakdowns and keep routes covered.
Preventive Maintenance and PM Compliance
The PM on-time rate is the percentage of scheduled preventive maintenance finished on time. Calculate it by dividing completed PM tasks by scheduled ones, then multiply by 100.
A rate below 85% can mean scheduling or shop problems. Regular preventive maintenance lowers the risk of breakdowns that disrupt routes.
Missing PM intervals leads to faster wear and more repairs. Tracking this metric shows if delays are due to vehicle availability, parts, or staffing.
High-performing fleets keep PM rates above 90%. This needs teamwork between dispatch, maintenance, and planning to get vehicles serviced without hurting operations.
Mean Time Between Failures (MTBF)
MTBF is the average time between breakdowns for a vehicle or fleet. Calculate it by dividing total operating hours by the number of failures in a period.
Higher MTBF means more reliable vehicles. A falling MTBF may mean maintenance needs to improve or vehicles are getting too old.
Track MTBF by vehicle type, age, and use to see trends. For routes, low MTBF causes scheduling problems and may mean extra vehicles are needed.
Mean Time to Repair (MTTR)
MTTR is the average time to finish repairs, from when a vehicle enters the shop to when it returns to service. This includes finding problems, getting parts, making repairs, and checks.
Lower MTTR means vehicles return to routes faster. Track MTTR separately for scheduled and unscheduled repairs, as unscheduled ones usually take longer.
Breaking down MTTR by repair type helps find slow spots in the process. To reduce MTTR, fleets need enough technicians, good parts stock, and the right tools.
Having parts on hand for common repairs can cut MTTR by 30-40% compared to ordering as needed.
Scheduled vs Unscheduled Service
The ratio of scheduled to unscheduled service shows how effective a maintenance program is. Fleet managers track the number of shop visits caused by breakdowns compared to planned maintenance appointments.
A healthy fleet usually keeps at least a 70:30 ratio in favor of scheduled work. High rates of unscheduled maintenance increase costs and disrupt routes.
Emergency repairs cost 3-4 times more than preventive maintenance. This is due to premium parts, overtime labor, and possible towing expenses.
Unexpected breakdowns cause vehicle downtime and create gaps in route coverage. These gaps lower customer service levels.
Service TypeCost ImpactDowntime ImpactPredictabilityScheduledLowerMinimalHighUnscheduled3-4x higherSignificantNone
Tracking this metric by vehicle age and type helps managers decide when to replace vehicles. Frequent unscheduled repairs may cost more than the vehicle's value.
Safety, Driver Behavior, and Compliance Metrics
Monitoring driver performance and regulatory compliance gives insight into fleet risk and quality. These metrics help identify coaching opportunities, track safety trends, and ensure legal compliance.
Driver Scorecard and Productivity
A driver scorecard combines several performance indicators into one tool. It measures both safety and efficiency.
Fleet managers track hard braking, speeding, rapid acceleration, distraction, and seatbelt use. This information comes from telematics systems and onboard cameras.
Common driver scorecard metrics include:
- Hard braking frequency per 100 miles
- Speeding violations and duration
- Idle time percentage
- Harsh cornering events
- Hours of service compliance
Driver productivity is measured along with safety metrics for a balanced view. This includes deliveries per shift, on-time completion rates, and route adherence.
Scorecards are most effective when used for driver coaching rather than punishment. Fleet KPIs from scorecards help managers spot top performers and drivers needing more training.
Regular reviews, such as weekly or monthly, let fleets track progress and adjust coaching as needed.
Accident and Incident Rates
The accident rate counts crashes per million miles driven. It is a key measure of fleet safety.
Incident rates cover near-misses, property damage, and minor collisions. These events might not be reportable accidents but still matter.
Tracking both rates separately gives better insight into safety trends. A fleet might have few accidents but many incidents, showing risky behavior.
Safety incidents should be sorted by severity, type, and cause to find patterns.
Key tracking elements:
Metric TypeMeasurementBenchmark FrequencyAccident rateCrashes per 1M milesMonthlyPreventable accidents% driver faultQuarterlyIncident rateEvents per 100 vehiclesWeekly
After an incident, analyzing driver data helps reveal causes like speeding or distraction. This guides coaching and policy changes.
Compliance and Inspection Rates
Compliance rates track how well fleets follow rules like hours of service, maintenance standards, and licensing. The inspection completion rate shows what percentage of required vehicle inspections are done on schedule.
The inspection pass/fail rate shows maintenance quality. DVIR (Driver Vehicle Inspection Report) completion is a key compliance metric.
Managers track how many drivers submit daily inspection reports and how quickly defects are fixed. Missed or late DVIRs can lead to violations and safety risks.
Inspections happen at different times: daily pre-trip checks, periodic DOT inspections, and annual certifications. The pass rate from roadside DOT inspections affects a fleet's safety rating and insurance costs.
A pass rate below 80% often points to maintenance or training problems. Compliance tracking also includes driver qualification files, medical certifications, and training records.
These metrics help fleets avoid violations and prove safety program effectiveness.
Telematics and Fleet Visibility
Modern telematics systems give fleet managers clear views of vehicle locations, driver behavior, and efficiency. Integrating telematics with fleet management software allows real-time monitoring of routes and supports data-driven decisions.
Telematics Data Integration
Telematics integration brings together GPS data, vehicle diagnostics, and ELD records in one place. This automates the collection of data like fuel use, idle time, speed, and maintenance alerts.
Fleet managers use dashboards to see real-time performance for many vehicles at once. The system collects engine diagnostics, driver hours, and route adherence in one platform.
Telematics data can be shared with accounting, dispatch, and maintenance systems. Integration needs compatible hardware, API connections, and standard data formats.
Most fleets start by tracking basics, then add advanced features like analytics and predictive maintenance.
Fleet Management Software
Fleet management software is the main tool for handling and analyzing telematics data. It turns raw data into useful insights for route planning, cost control, and performance tracking.
Features include vehicle health monitoring, fuel tracking, and driver safety scoring. The software combines data from many sources to report on cost per mile, delivery rates, and maintenance.
Cloud-based platforms let managers access data from anywhere. The software sends alerts for speeding, unauthorized use, and scheduled maintenance.
GPS Tracking and Route Planning
GPS tracking gives real-time vehicle locations for route analysis. Managers can watch active routes, spot delays, and help drivers with updated directions.
Route planning tools use past GPS data to improve future assignments and cut down on miles driven. The system reviews completed routes to find inefficiencies and suggests ways to combine stops.
GPS data helps calculate actual versus planned route adherence. Fleet visibility through GPS lets dispatchers answer customer questions and quickly send vehicles to urgent calls.
The technology also records arrival and departure times for proof of service.
Sustainability and Environmental Metrics
Measuring environmental impact is now a key part of fleet performance. Fleet managers track carbon emissions, fuel use, and sustainable practices to reduce their environmental footprint.
Fuel Efficiency and MPG
Fuel efficiency is the main way to measure resource use and environmental impact. Miles per gallon (MPG) compares vehicle performance across routes, drivers, and vehicle types.
Managers track MPG to find waste in routing, maintenance, or driving habits. Low fuel economy may mean mechanical problems, bad routes, or aggressive driving.
Telematics systems measure real-time fuel use. Managers can see MPG for each trip and for the whole fleet.
Key fuel efficiency metrics include:
- Average MPG per vehicle and fleet-wide
- Fuel consumption per mile or kilometer
- Fuel usage per delivery or service call
- Idle time fuel consumption
Differences in MPG on similar routes or vehicles show where to improve. Regular checks help set baselines and measure progress.
Carbon Emissions
Carbon emissions tracking measures the environmental impact of fleet operations. Emissions are calculated from fuel use, vehicle type, and emission factors.
The main metric is grams of CO2 per mile or kilometer. This includes direct emissions from fuel and, for electric vehicles, indirect emissions from electricity.
Accurate reporting needs detailed fuel records and vehicle-specific data. Many organizations compare emissions to reduction targets or regulations.
Transportation fleets make up a large part of corporate carbon footprints. Emissions metrics are important for sustainability reports and compliance.
Sustainable Fleet Practices
Sustainable fleet practices go beyond basic emissions tracking. They include operational strategies that reduce environmental impact.
Route optimization helps cut unnecessary mileage and fuel use. It does this by finding the most efficient paths for deliveries and service calls.
Vehicle utilization rates show how well fleet assets are used. Better utilization means fewer vehicles are needed for the same amount of work.
Fewer vehicles on the road leads to lower emissions. Maintenance schedules that focus on engine efficiency and tire pressure also help improve fuel economy.
Fleet composition choices now include more alternative fuel and electric vehicles. These changes require new ways to measure charging infrastructure efficiency and battery health.
It is also important to consider the total environmental impact of these vehicles over their entire lifespan. This comparison helps fleets make better decisions than just relying on conventional vehicles.