Construction Fleet Analytics: How Data-Driven Insights Improve Equipment Performance and ROI
How to start saving money
Lorem ipsum dolor sit amet, consectetur adipiscing elit lobortis arcu enim urna adipiscing praesent velit viverra sit semper lorem eu cursus vel hendrerit elementum morbi curabitur etiam nibh justo, lorem aliquet donec sed sit mi dignissim at ante massa mattis.
- Neque sodales ut etiam sit amet nisl purus non tellus orci ac auctor
- Adipiscing elit ut aliquam purus sit amet viverra suspendisse potent
- Mauris commodo quis imperdiet massa tincidunt nunc pulvinar
- Excepteur sint occaecat cupidatat non proident sunt in culpa qui officia
Why it is important to start saving
Vitae congue eu consequat ac felis placerat vestibulum lectus mauris ultrices cursus sit amet dictum sit amet justo donec enim diam porttitor lacus luctus accumsan tortor posuere praesent tristique magna sit amet purus gravida quis blandit turpis.

How much money should I save?
At risus viverra adipiscing at in tellus integer feugiat nisl pretium fusce id velit ut tortor sagittis orci a scelerisque purus semper eget at lectus urna duis convallis. porta nibh venenatis cras sed felis eget neque laoreet suspendisse interdum consectetur libero id faucibus nisl donec pretium vulputate sapien nec sagittis aliquam nunc lobortis mattis aliquam faucibus purus in.
- Neque sodales ut etiam sit amet nisl purus non tellus orci ac auctor
- Adipiscing elit ut aliquam purus sit amet viverra suspendisse potenti
- Mauris commodo quis imperdiet massa tincidunt nunc pulvinar
- Adipiscing elit ut aliquam purus sit amet viverra suspendisse potenti
What percentege of my income should go to savings?
Nisi quis eleifend quam adipiscing vitae aliquet bibendum enim facilisis gravida neque. Velit euismod in pellentesque massa placerat volutpat lacus laoreet non curabitur gravida odio aenean sed adipiscing diam donec adipiscing tristique risus. amet est placerat in egestas erat imperdiet sed euismod nisi.
“Nisi quis eleifend quam adipiscing vitae aliquet bibendum enim facilisis gravida neque velit euismod in pellentesque”
Do you have any comments? Share them with us on social media
Eget lorem dolor sed viverra ipsum nunc aliquet bibendum felis donec et odio pellentesque diam volutpat commodo sed egestas aliquam sem fringilla ut morbi tincidunt augue interdum velit euismod eu tincidunt tortor aliquam nulla facilisi aenean sed adipiscing diam donec adipiscing ut lectus arcu bibendum at varius vel pharetra nibh venenatis cras sed felis eget.
Construction fleet management has evolved from manual tracking and spreadsheets to advanced, data-driven systems. These systems provide real-time visibility across every asset.
Construction fleet analytics turns raw data from vehicles, equipment, and maintenance systems into insights that improve project profitability, resource allocation, and fleet performance. This evolution addresses the complexity and cost pressures of modern construction operations.
Fleet analytics does more than track equipment locations. It helps construction companies answer key questions about asset utilization, maintenance timing, operational costs, and resource deployment.
The process collects data from telematics, fuel records, work orders, and usage patterns. This information supports strategic decisions and reduces reactive management.
Understanding how these systems work and which features offer the most value is crucial. Effective implementation can turn a fleet into a competitive advantage.
The landscape is changing with new technologies and methods for construction fleet optimization.
Understanding Construction Fleet Analytics

Construction fleet analytics turns raw data from equipment, vehicles, and tools into insights for better decision-making. This approach uses tracking technology, data collection systems, and analytics to help companies manage their assets.
Definition and Core Concepts
Construction fleet analytics is the systematic collection and interpretation of data from equipment and vehicles. It tracks location, utilization rates, maintenance schedules, fuel use, and performance metrics.
Core components include:
- Data from GPS devices, telematics, and IoT sensors
- Standardizing information from different equipment types
- Real-time monitoring of equipment status and conditions
- Historical analysis to spot trends in fleet performance
Analytics goes beyond location tracking. It includes cycle times, load performance, idle rates, and productivity metrics to show how efficiently equipment operates.
Modern systems use automated data collection instead of paper logs and manual spreadsheets. This provides continuous visibility into fleet operations.
Role in the Construction Industry
Construction fleet analytics helps coordinate multiple projects with different deadlines and resources. Fleet data becomes the basis for operational decisions.
The technology allows centralized management across many job sites. Companies use analytics to send equipment where it is needed most, reducing idle machines and project delays.
Analytics also supports compliance, safety, and risk management. Companies track operator behavior, equipment certifications, and maintenance to reduce accidents and equipment failures.
Key Benefits for Construction Companies
Equipment utilization improves when underused assets are identified and moved to active sites. Analytics shows which machines generate revenue and which only add maintenance costs.
Financial benefits include:
- Lower fuel costs by monitoring idle time and optimizing routes
- Reduced maintenance expenses through predictive servicing
- Increased project profitability with better resource allocation
- Fewer equipment rentals when fleet capacity is fully used
Historical fleet data helps with faster and more accurate project estimates. Insights lead to better workflows and smarter equipment purchases and deployment strategies.
How Construction Fleet Analytics Works
Construction fleet analytics uses three main systems: telematics and IoT sensors to capture data, data ingestion platforms to consolidate information, and dashboards to present insights.
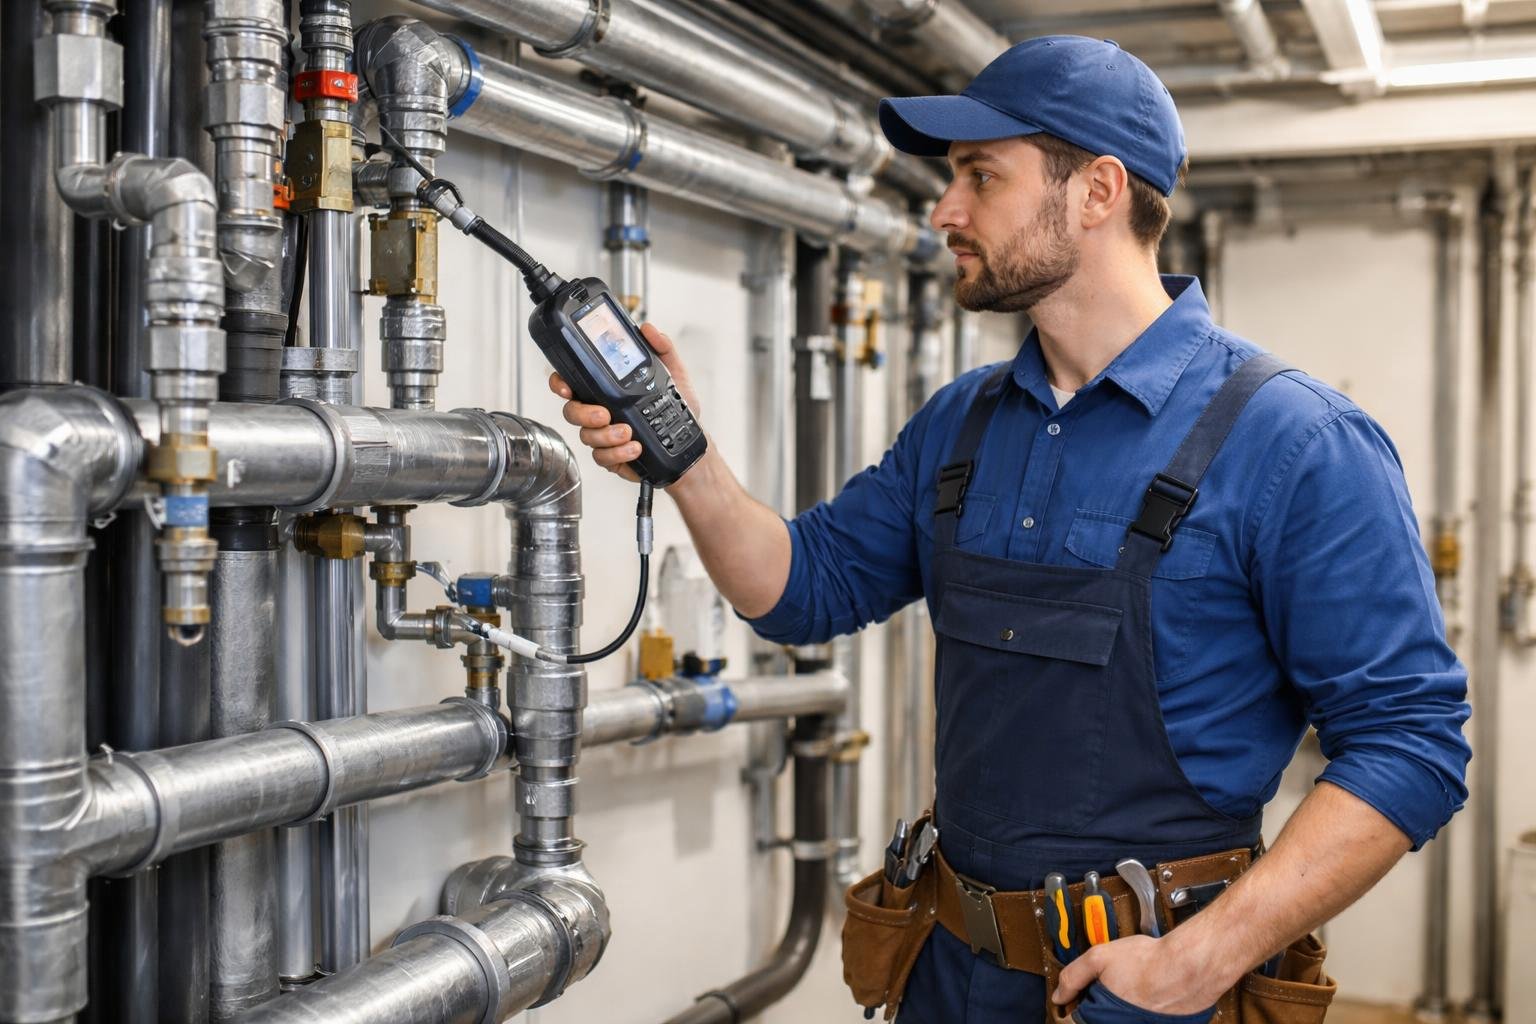
Telematics and IoT Sensors in Construction
Telematics devices and IoT sensors collect operational data from vehicles and equipment. These devices work continuously throughout each workday.
GPS modules track equipment location and movement. Engine sensors monitor fuel use, idle time, operating hours, and performance metrics.
Additional sensors measure hydraulic pressure, temperature, and load weights. Telematics data is sent wirelessly to central systems at regular intervals.
This automatic collection replaces manual tracking and covers the entire fleet. Modern systems capture both standard and equipment-specific data.
For example, excavator sensors track bucket cycles and dig depth. Concrete mixers monitor drum rotation speed and material temperature.
Data Ingestion and Integration Capabilities
Data ingestion systems collect information from multiple telematics sources. They consolidate it into unified databases.
Integration connects fleet analytics with construction management software, ERP systems, and scheduling tools. This creates a connected ecosystem where equipment data flows with project timelines and financial information.
The harmonization process standardizes data from different manufacturers. This ensures consistent analytics across mixed fleets.
Key integration points:
- Maintenance management systems
- Project scheduling software
- Fuel management platforms
- Asset tracking databases
- Billing and invoicing systems
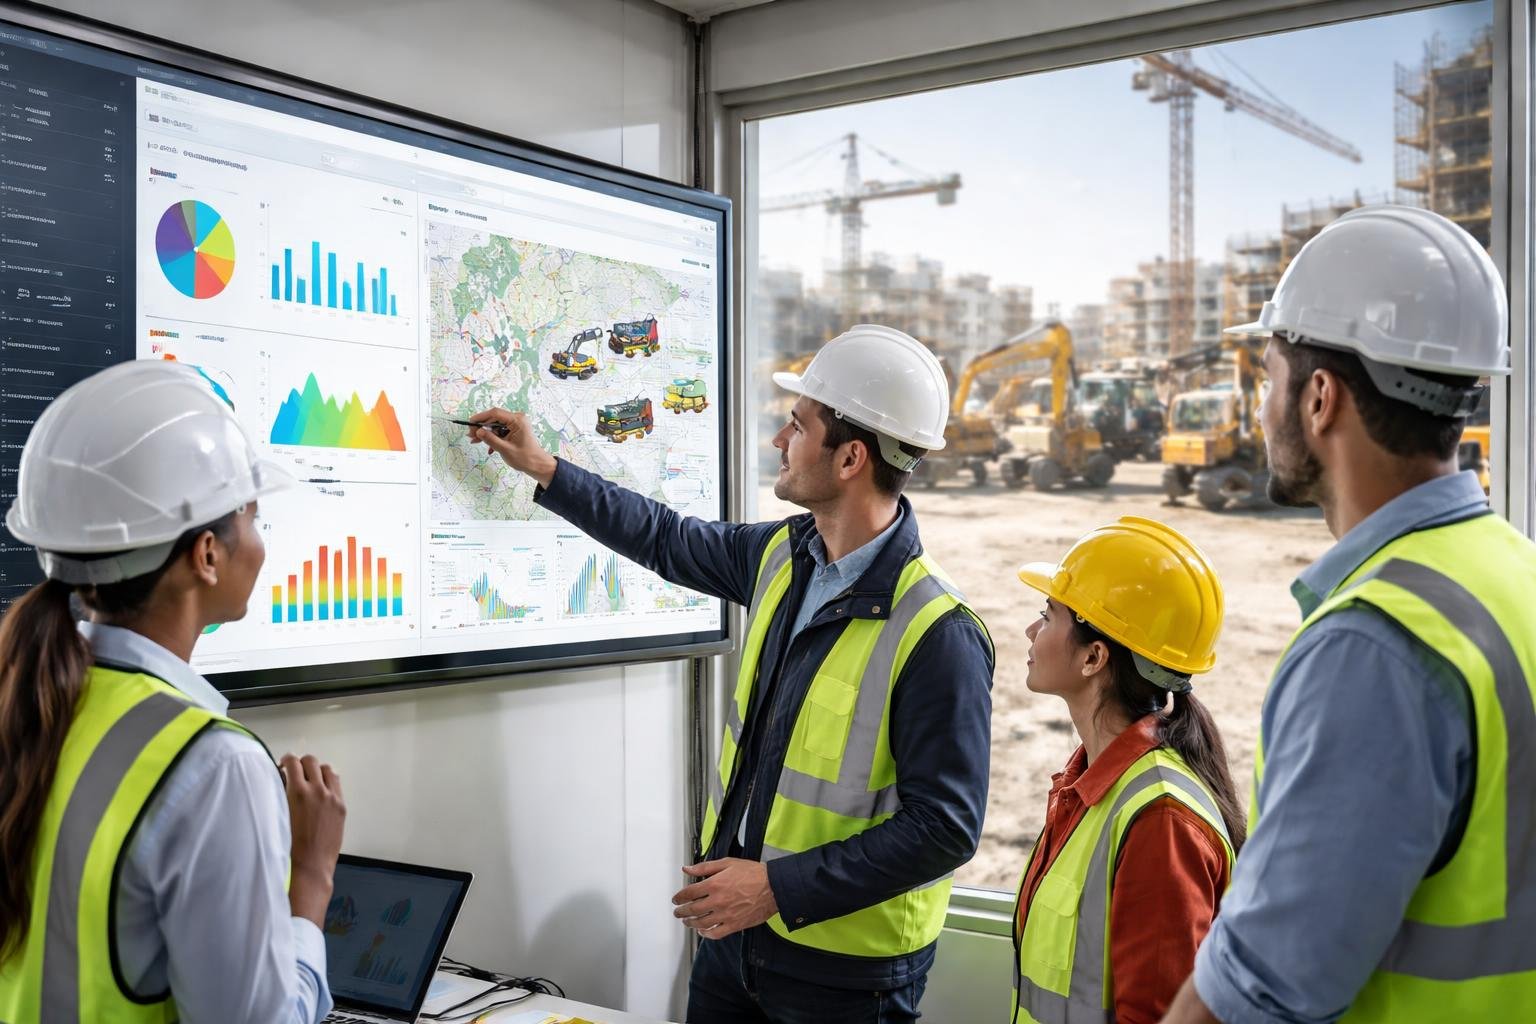
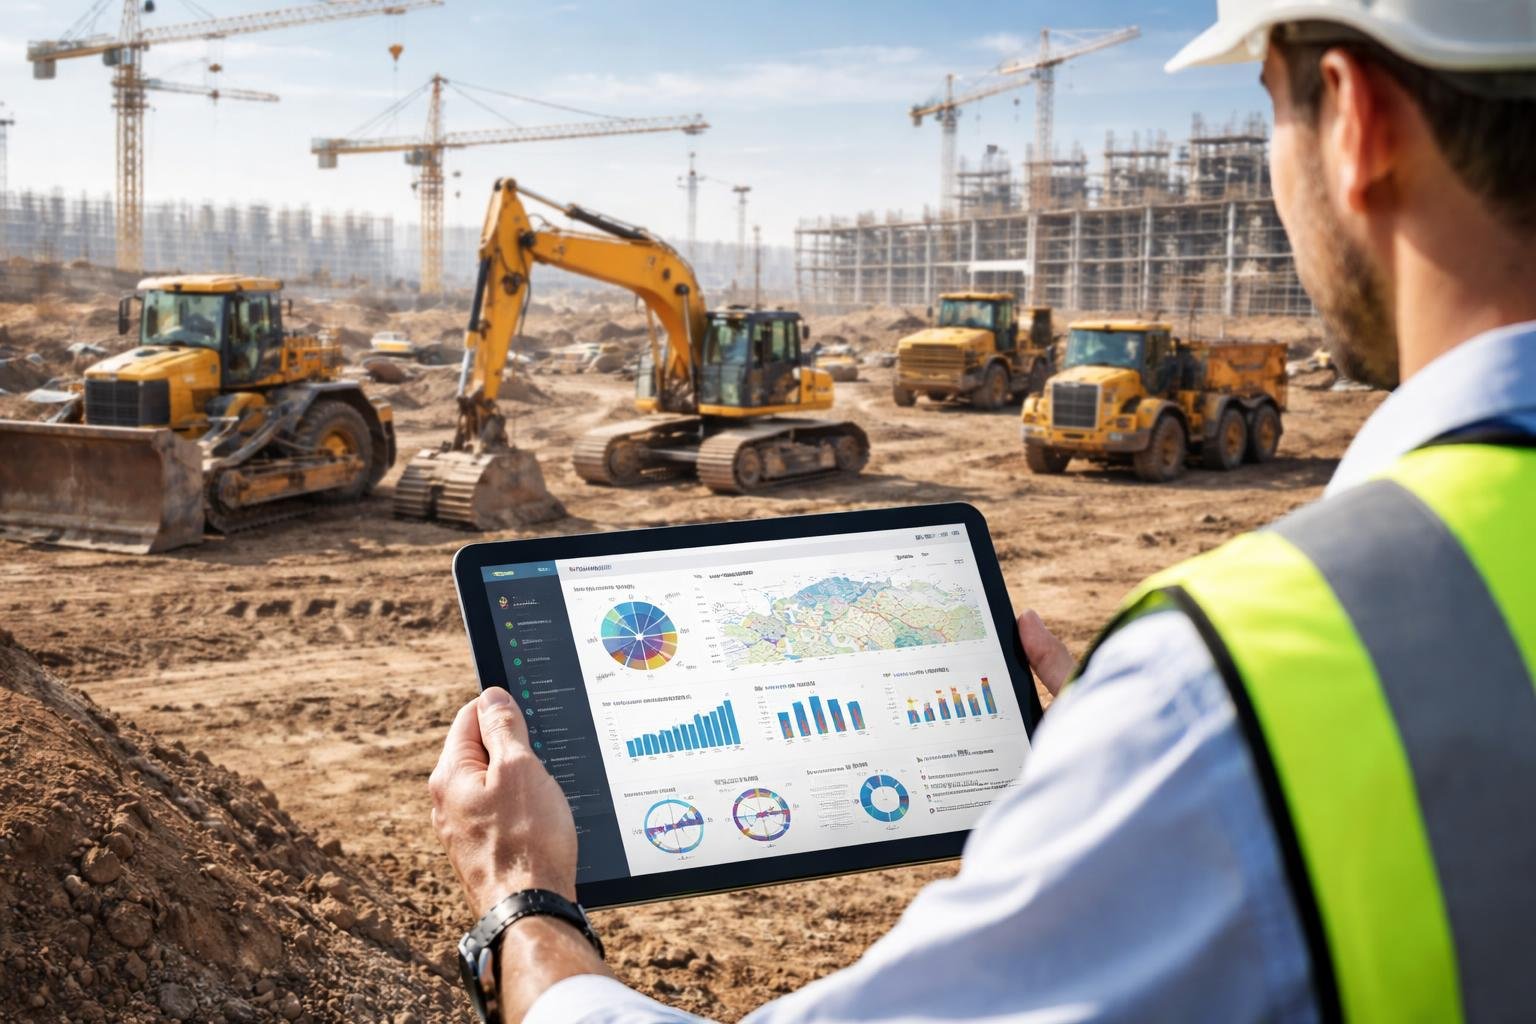
Dashboard and Real-Time Data Visualization
Analytics dashboards turn processed data into visual interfaces for daily operations. Real-time tracking shows equipment locations, status, and performance through maps and charts.
Visualizations present fleet information with graphs, heat maps, and status indicators. Managers can see fuel trends, utilization rates, and maintenance schedules quickly.
Real-time reporting enables fast responses to changing situations. Alerts notify managers when equipment leaves zones or has long idle periods.
Customizable views let stakeholders access relevant information. Project managers focus on equipment availability, while maintenance teams monitor service intervals. Fleet directors review utilization rates and costs across job sites.
Core Features of Modern Fleet Analytics Solutions
Modern fleet analytics platforms provide operational control with real-time data, automated maintenance scheduling, performance reports, and compliance tracking. These features turn raw data into insights that reduce downtime and optimize resources.
Fleet Tracking and Asset Utilization
Construction fleet tracking gives real-time visibility into equipment location and status. GPS-enabled devices capture continuous data on asset deployment and idle times.
Asset utilization metrics convert tracking data into performance indicators. Fleet managers can spot underused or overused equipment and adjust resources as needed.
Equipment utilization rates typically rise 15-25% when managers use tracking insights. Advanced systems also track smaller tools, creating full fleet visibility.
This reduces asset loss, rental costs, and ensures equipment reaches the right location on time. Geofencing triggers alerts when equipment leaves zones or operates outside approved hours.
Predictive and Preventive Maintenance
Predictive maintenance uses sensor data and machine learning to find failure patterns before breakdowns. Changes in engine temperature, hydraulic pressure, or vibration signal potential problems.
Preventive maintenance schedules automate service intervals based on actual equipment use. Hour meters and fuel rates determine when maintenance is needed.
Proactive maintenance combines both approaches to minimize downtime. Analytics platforms generate work orders automatically when service is due or when sensors detect issues.
Maintenance teams get diagnostic information that speeds up repairs.
Maintenance TypeTrigger MethodPrimary BenefitPredictiveSensor data patternsPrevents failures before occurrencePreventiveUsage-based intervalsOptimizes service timingProactiveCombined analyticsMinimizes total downtime
Customizable Reporting and Analytics Tools
Customizable dashboards show each stakeholder the metrics they need. Operations managers see equipment status, while financial teams track costs.
Users can arrange dashboard layouts, pick KPIs, and set time ranges. Reports transform data into formatted documents for different audiences.
Automated reports deliver daily summaries, weekly analyses, and monthly breakdowns. Users set report parameters and delivery schedules.
Advanced platforms let users drill down into anomalies, compare performance, and spot trends. Export options support integration with accounting and project management systems.
Safety and Compliance Monitoring
Safety compliance tracking monitors driver behavior, equipment certifications, and regulations. Telematics record harsh braking, speeding, and rapid acceleration.
These metrics help managers identify operators needing training and recognize safe practices. Equipment tracking covers certification and inspection schedules.
Analytics platforms keep digital records of licenses, certifications, and inspections. Alerts notify managers about expiring certifications or overdue inspections.
Compliance monitoring includes OSHA, DOT, and local safety rules. Digital checklists ensure inspections are done, and automated documentation creates audit trails.
These features reduce violation risks and help protect workers.
Operational and Financial Impact on Construction Projects
Fleet analytics improves daily operations and financial results. Companies often see better equipment utilization, fuel consumption, and maintenance scheduling within the first year.
Reducing Idle Time and Equipment Downtime
Fleet analytics tracks real-time equipment usage to find unused assets. Many companies discover 20-30% of their fleet sits idle during billable hours.
GPS and engine hour monitoring show which machines are left running during breaks. These systems flag downtime as it happens, letting managers reassign equipment quickly.
Alerts notify maintenance teams when equipment goes offline. Historical data reveals patterns of downtime by time and location.
Reducing idle time increases equipment ROI by boosting productive hours per asset. Companies can delay new purchases when existing machines are used more. Some firms cut fleet size by 10-15% after optimizing deployment schedules.
Improving Fuel Efficiency and Cost Savings
Fuel monitoring systems integrated with analytics often reduce annual fuel spend by 10-15%. Telematics measure fuel rates and spot inefficient behaviors like long idling or harsh driving.
Route optimization reduces travel distances between sites and yards. Real-time traffic data helps choose the best paths for moving equipment.
Operators get feedback on driving patterns that waste fuel. Analytics dashboards compare fuel efficiency across equipment and operators.
Benchmarking reveals cost-saving opportunities. Managers can set fuel budgets per project and receive alerts when consumption exceeds targets.
Lowering Maintenance and Insurance Costs
Predictive maintenance algorithms analyze equipment telemetry to schedule service based on actual wear. This prevents costly emergency repairs and extends asset lifespans.
Maintenance efficiency improves when teams address issues before breakdowns. Fleet analytics reduce maintenance costs by eliminating unnecessary preventive service on lightly-used equipment.
Usage-based maintenance schedules align service intervals with engine hours and operating conditions. Digital maintenance logs create audit trails that prove compliance with manufacturer requirements.
Insurance premiums decrease when companies demonstrate proactive fleet management and safety monitoring. Telematics data provides evidence of proper equipment operation and maintenance practices.
Some insurers offer premium reductions for fleets with comprehensive tracking systems and documented safety protocols.
Enhancing Decision-Making with Fleet Analytics
Construction fleet analytics transforms raw data into actionable intelligence that impacts equipment utilization, cost control, and project timelines. Fleet managers use these insights to make informed decisions about resource allocation, maintenance scheduling, and strategic planning.
Performance Analytics and Operational Insights
Performance analytics measures key metrics such as equipment utilization rates, idle time, fuel consumption, and productivity levels. These measurements help fleet managers identify underperforming assets and redistribute resources where they generate the most value.
Operational insights reveal patterns in equipment usage, operator behavior, and site-specific performance. Fleet management systems track data points including hours operated, location history, payload weights, and attachment usage.
This information helps managers understand which machines deliver optimal performance and which require intervention. Key performance indicators typically monitored include:
- Equipment utilization rates: percentage of time assets actively contribute to revenue-generating work
- Cost per operating hour: total expenses divided by productive runtime
- Fuel efficiency metrics: consumption rates compared across equipment types and operators
- Maintenance cost ratios: repair expenses relative to asset value and usage
Fleet analytics platforms consolidate data from telematics devices, fuel systems, and maintenance records into dashboards. Managers can quickly spot issues such as excessive fuel consumption or declining productivity before they escalate.
Data-Driven Fleet Management Practices
Data-driven fleet management relies on concrete metrics instead of intuition or past practices. Construction companies analyze historical performance data to set benchmarks, establish targets, and measure progress.
Fleet managers use analytics to match machine capabilities with specific job requirements. Data reveals which equipment types perform best under particular conditions, enabling more accurate project planning and bid estimation.
Resource allocation decisions benefit from insights into seasonal demand, geographic trends, and project-specific equipment needs. Companies can determine optimal fleet sizes, identify surplus equipment for disposal, and justify capital expenditures with documented performance gaps.
Maintenance scheduling shifts from calendar-based intervals to condition-based triggers informed by actual usage and wear. This reduces unnecessary service and helps prevent unexpected failures.
Role of Machine Learning and Predictive Analytics
Machine learning algorithms analyze large datasets from multiple sources to identify patterns that humans might miss. These systems learn from historical equipment performance, failure records, and operating conditions to make accurate predictions.
Predictive analytics forecasts maintenance needs by recognizing early warning signs of component degradation. The technology processes sensor data, fault codes, and operating parameters to predict when parts will need replacement.
This helps prevent unexpected breakdowns and allows procurement teams to order parts in advance. Fleet optimization benefits from predictive models that forecast equipment availability, estimate project completion dates, and recommend ideal machine assignments.
Machine learning considers factors like weather, operator skill, terrain, and historical productivity data. Advanced analytics platforms continuously refine their predictions as they incorporate new operational data.
Selecting and Implementing Construction Fleet Analytics Solutions
Successful deployment of construction fleet analytics requires careful evaluation of technical capabilities, strong data management protocols, and organizational alignment. The right approach balances immediate operational needs with long-term scalability.
Evaluating Software Features and Integration
Selecting fleet management software starts with assessing analytical capabilities against operational requirements. AI-powered predictive maintenance, real-time telematics integration, and automated reporting are essential features.
Data integration capabilities determine whether a platform can combine information from IoT sensors, GPS devices, and equipment management systems. Fleet management software must connect with enterprise resource planning tools, accounting platforms, and project management applications to avoid data silos.
Key technical requirements include:
- IoT compatibility for real-time equipment monitoring
- API availability for custom integrations with legacy systems
- Mobile accessibility for field teams and operators
- Customizable dashboards that display relevant KPIs by role
Vendors should provide detailed documentation of their integration architecture and demonstrate successful implementations in similar environments. Testing data flows during pilot programs reveals compatibility issues before full deployment.
Data Governance and Interoperability
Data governance establishes ownership, quality standards, and access controls for fleet information. Clear protocols define how data is collected, validated, stored, and shared.
Interoperability standards ensure systems exchange information accurately without manual intervention. Companies operating multiple job sites need platforms that maintain data consistency across locations while accommodating site-specific needs.
A master data repository prevents conflicting information about equipment status, maintenance schedules, and utilization rates. Regular audits verify data accuracy and identify inconsistencies.
Access permissions must balance transparency with security, allowing project managers to view relevant fleet data while protecting sensitive information. Role-based controls enable appropriate visibility without exposing the entire dataset.
Change Management and Continuous Improvement
Implementation success depends on structured change management that addresses technical and cultural barriers. Training programs should equip operators, supervisors, and analysts to use new analytical tools in their daily work.
Early adoption challenges often stem from resistance to increased visibility and accountability. Demonstrating quick wins, such as reduced fuel costs or improved equipment availability, builds stakeholder buy-in.
Continuous improvement frameworks help fleet analytics evolve into a competitive advantage. Regular review cycles assess whether the system delivers expected ROI and identify opportunities to expand analytical capabilities.
Feedback loops between field teams and system administrators ensure the platform adapts to real-world usage patterns. Companies achieving sustainable results establish dedicated analytics teams to translate raw data into actionable decisions.
Trends and Future Directions in Construction Fleet Analytics
Construction fleet analytics is advancing through artificial intelligence integration, cross-site optimization, and enterprise-level reporting systems. These developments address industry challenges in cost control, equipment utilization, and predictive maintenance across distributed operations.
AI-Powered Analytics and Predictive Modeling
Artificial intelligence now powers predictive maintenance systems that analyze sensor data, historical performance, and operating conditions to forecast failures. Modern fleet management software uses machine learning to identify maintenance needs based on actual usage, reducing unexpected downtime.
Predictive modeling also covers fuel consumption forecasting, operator performance optimization, and total cost of ownership calculations. AI systems process telematics data, engine diagnostics, and operational metrics to recommend equipment replacement timing and fleet composition adjustments.
Construction tech platforms increasingly use neural networks that learn from fleet behavior across thousands of machines. This data helps managers predict which equipment configurations perform best under specific job site conditions.
Multi-Project and Multiple Job Site Optimization
Analytics platforms now provide unified visibility across multiple job sites. Construction companies can optimize equipment allocation between concurrent projects.
Fleet managers can identify underutilized assets at one location and redeploy them to sites with higher demand. This improves overall equipment utilization rates.
Cross-project analytics reveal patterns in equipment demand, enabling better procurement decisions and rental versus ownership evaluations. Companies track machine hours, fuel consumption, and maintenance costs across their portfolio to calculate total cost of ownership for different equipment types.
Route optimization algorithms coordinate equipment movement between job sites, reducing transportation costs and delays. These systems factor in project timelines, equipment availability, and logistical constraints to generate optimal deployment schedules.
Scalability and Advanced Reporting
Enterprise fleet management systems handle thousands of assets across regional or national operations. They process millions of data points daily from GPS trackers, telematics devices, and IoT sensors.
Cloud-based platforms offer the power needed to analyze this data in real time. They maintain performance even as fleets grow.
Advanced reporting tools create customized dashboards for different stakeholders. Executives see summaries of fleet performance, while technicians get detailed reports on individual machine diagnostics.
These systems connect with enterprise resource planning and accounting software. This integration links fleet data with financial analysis.
Scalable analytics architectures support API integrations with manufacturer telematics systems. Companies can consolidate data from mixed fleets, no matter the equipment brand.
This interoperability removes data silos. It enables analysis across all assets.