How to start saving money
Lorem ipsum dolor sit amet, consectetur adipiscing elit lobortis arcu enim urna adipiscing praesent velit viverra sit semper lorem eu cursus vel hendrerit elementum morbi curabitur etiam nibh justo, lorem aliquet donec sed sit mi dignissim at ante massa mattis.
- Neque sodales ut etiam sit amet nisl purus non tellus orci ac auctor
- Adipiscing elit ut aliquam purus sit amet viverra suspendisse potent
- Mauris commodo quis imperdiet massa tincidunt nunc pulvinar
- Excepteur sint occaecat cupidatat non proident sunt in culpa qui officia
Why it is important to start saving
Vitae congue eu consequat ac felis placerat vestibulum lectus mauris ultrices cursus sit amet dictum sit amet justo donec enim diam porttitor lacus luctus accumsan tortor posuere praesent tristique magna sit amet purus gravida quis blandit turpis.

How much money should I save?
At risus viverra adipiscing at in tellus integer feugiat nisl pretium fusce id velit ut tortor sagittis orci a scelerisque purus semper eget at lectus urna duis convallis. porta nibh venenatis cras sed felis eget neque laoreet suspendisse interdum consectetur libero id faucibus nisl donec pretium vulputate sapien nec sagittis aliquam nunc lobortis mattis aliquam faucibus purus in.
- Neque sodales ut etiam sit amet nisl purus non tellus orci ac auctor
- Adipiscing elit ut aliquam purus sit amet viverra suspendisse potenti
- Mauris commodo quis imperdiet massa tincidunt nunc pulvinar
- Adipiscing elit ut aliquam purus sit amet viverra suspendisse potenti
What percentege of my income should go to savings?
Nisi quis eleifend quam adipiscing vitae aliquet bibendum enim facilisis gravida neque. Velit euismod in pellentesque massa placerat volutpat lacus laoreet non curabitur gravida odio aenean sed adipiscing diam donec adipiscing tristique risus. amet est placerat in egestas erat imperdiet sed euismod nisi.
“Nisi quis eleifend quam adipiscing vitae aliquet bibendum enim facilisis gravida neque velit euismod in pellentesque”
Do you have any comments? Share them with us on social media
Eget lorem dolor sed viverra ipsum nunc aliquet bibendum felis donec et odio pellentesque diam volutpat commodo sed egestas aliquam sem fringilla ut morbi tincidunt augue interdum velit euismod eu tincidunt tortor aliquam nulla facilisi aenean sed adipiscing diam donec adipiscing ut lectus arcu bibendum at varius vel pharetra nibh venenatis cras sed felis eget.
Fuel consumption monitoring is the systematic process of collecting, measuring, and analyzing fuel use data across a fleet to reduce cost per mile, catch maintenance problems early, and meet emissions reporting requirements. For most North American fleets, fuel accounts for roughly 30% of total operating costs, which makes it the single largest controllable expense a manager can act on directly.
Three outcomes drive adoption:
- Reduced fuel spend: Identifying idle time, inefficient routes, and aggressive driving patterns cuts consumption without replacing a single vehicle.
- Proactive maintenance: Fuel anomalies, such as a sudden drop in MPG or a spike in idle fuel rate, often signal engine issues before they cause a breakdown. Penske recommends correlating fuel data with engine metrics to detect performance problems early.
- Emissions tracking: Converting fuel data to CO2 equivalents satisfies sustainability reporting and, increasingly, customer contract requirements.
A 30–60 day baseline is the industry-standard starting point for establishing normal consumption ranges. Deviations beyond 8–12% from that baseline typically trigger alerts worth investigating; this 8–12% variance threshold should be set only after initial baseline data is collected, to avoid false positives.
Key Takeaways
Fuel consumption monitoring works best when it combines at least two data sources, starts with a 30–60 day baseline, and ties alerts to an 8–12% variance threshold before scaling across the fleet.
| Point | Details |
|---|---|
| Establish a baseline first | Collect 30–60 days of data before setting variance alerts to avoid false positives. |
| Use two data sources | Combining fuel-card transactions with GPS or ECM data reveals fraud and consumption gaps that neither source shows alone. |
| Fuel is ~30% of operating costs | Monitoring KPIs like MPG, idle rate, and variance % directly targets the largest controllable fleet expense. |
| Alert at 8–12% deviation | Thresholds set within this range balance sensitivity and noise for most North American fleet types. |
| Motowatchdog for GNSS layer | Subscription-free GPS devices provide trip, mileage, and idle data with no monthly fee, lowering the cost of the GNSS monitoring layer. |
Table of Contents
- What does fuel consumption monitoring actually measure?
- Which KPIs should you track on a fuel consumption dashboard?
- Where does fuel monitoring deliver the most value?
- How to implement fuel monitoring in your fleet
- How accurate is fuel consumption data, and what goes wrong?
- How do GNSS trip models estimate fuel without engine data?
- How Motowatchdog fits into a fuel monitoring program
- The data-first approach most fleets skip
- Motowatchdog makes the GNSS layer affordable
- Sources
What does fuel consumption monitoring actually measure?
A complete monitoring program pulls data from several hardware layers and routes it through a cloud platform to a dashboard or alert system.
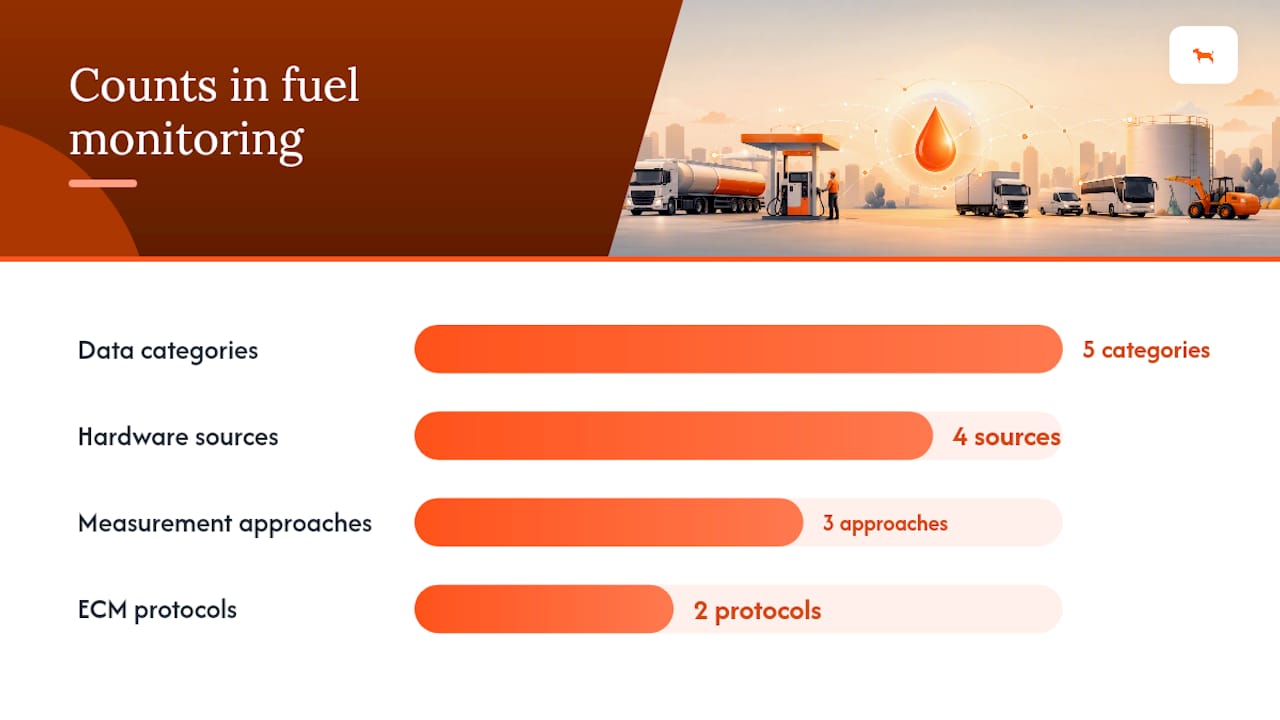
Hardware sources:
- ECM via OBD-II or J1939 CAN bus: Reads instantaneous fuel rate and cumulative consumption directly from the engine control module. This is the most accurate method for light-duty (OBD-II) and commercial (J1939) vehicles.
- Flow meters and tank-level sensors: Used on bulk storage tanks and equipment without ECM outputs.
- Fuel card feeds: Capture purchase transactions at the pump, including volume, location, and time.
- GNSS/GPS devices: Record trip speed profiles and mileage, enabling trip-based fuel estimation when ECM data is unavailable.
Data flows from sensor to telematics device, over a mobile network to a cloud platform, and then surfaces as dashboard metrics and threshold alerts. A complete fuel management system tracks five data categories: transaction, consumption, inventory, variance, and exception. Integrating fuel-card transactions with telematics readings is where variance and fraud detection become possible.
The three measurement approaches differ significantly in accuracy and cost:
- ECM/telematics: Highest accuracy; reads real engine output. Requires hardware installation.
- Fuel-card only: Captures purchase volume, not actual consumption. Gaps between fill-ups hide real-time behavior.
- GNSS/trip modeling: Estimates consumption from speed profiles using vehicle-type coefficients. ISO 23795-1 specifies this method for per-trip fuel and CO2 estimation when on-board engine telemetry is absent.
Pro Tip: If your fleet mixes late-model trucks with older equipment lacking OBD-II ports, use ECM-based tracking on the newer vehicles and GNSS trip modeling on the older ones. A hybrid approach gives you coverage without forcing a full hardware replacement.
Establishing a 30–60 day baseline before setting alerts prevents false positives. Once baseline data exists, setting an alert threshold in the 8–12% variance range provides a practical starting point for exception reporting.
Which KPIs should you track on a fuel consumption dashboard?
| KPI | Measurement source | Primary use case |
|---|---|---|
| MPG | ECM + GPS distance | Operational efficiency, benchmarking |
| Instantaneous fuel rate (gal/hr) | ECM direct read | Idle detection, engine load monitoring |
| Per-trip fuel consumption | ECM or GNSS model | Route comparison, driver coaching |
| Variance % (expected vs. actual) | Fuel card vs. telematics | Fraud detection, anomaly alerts |
| Idle fuel (gal/hr × idle minutes) | ECM idle parameter | Cost reduction, emissions compliance |
| CO2 per mile | Derived from fuel × emission factor | Sustainability reporting |
MPG is the most universal benchmark for fleet comparisons. Instantaneous fuel rate, measured in gallons per hour, is the right metric for idle monitoring because a truck sitting at idle can consume 0.8–1.0 gallons per hour without moving a mile. Variance percentage, calculated by comparing what the fuel card recorded against what the ECM consumed, is the primary fraud-detection signal. For IFTA compliance, per-trip fuel broken down by jurisdiction is the required input.
Where does fuel monitoring deliver the most value?
Fleet-level fuel monitoring reveals inefficiencies in routing, driving behavior, and equipment specification that compound across fleet mileage. A one-MPG improvement on a 20-vehicle fleet running 30,000 miles per year per vehicle produces measurable savings at any diesel price.
Specific use cases where monitoring pays off fastest:
- Driver coaching: Trip-level MPG reports identify which drivers consistently underperform the fleet average. Targeted coaching on acceleration, braking, and speed compliance typically produces the fastest per-dollar return.
- Fraud and theft detection: Comparing fuel-card purchase volume against ECM consumption flags mismatches. A purchase recorded at a location outside a vehicle’s GPS path is a clear exception event.
- IFTA reporting: Automated per-jurisdiction mileage and fuel data replaces manual log reconciliation for interstate carriers.
- Eco-routing: Combining fuel rate data with route history shows which corridors produce the worst consumption per mile, informing dispatch decisions.
- Preventive maintenance: A truck showing a 15% MPG decline over two weeks without a route change warrants a diagnostic check before it fails on the road.
Fuel anomalies are often the first measurable signal of an engine problem. Correlating a sudden consumption spike with engine fault codes, as Penske’s fuel-tracking guidance recommends, lets maintenance teams schedule repairs before a breakdown occurs rather than after.
How to implement fuel monitoring in your fleet
- Audit your current fuel flows. List every vehicle, fuel card account, on-site tank, and maintenance record. Identify which vehicles have OBD-II ports, which use J1939 CAN, and which have neither.
- Choose your measurement mix. ECM-based telematics for vehicles with accessible ports; GNSS trip modeling for older or non-instrumented equipment; fuel-card integration for all vehicles.
- Select a pilot group. Pick 5–10 vehicles that represent your typical duty cycles: a mix of highway routes, urban stop-and-go, and heavy-load applications. See the small fleet tracking guide for cost-conscious hardware selection.
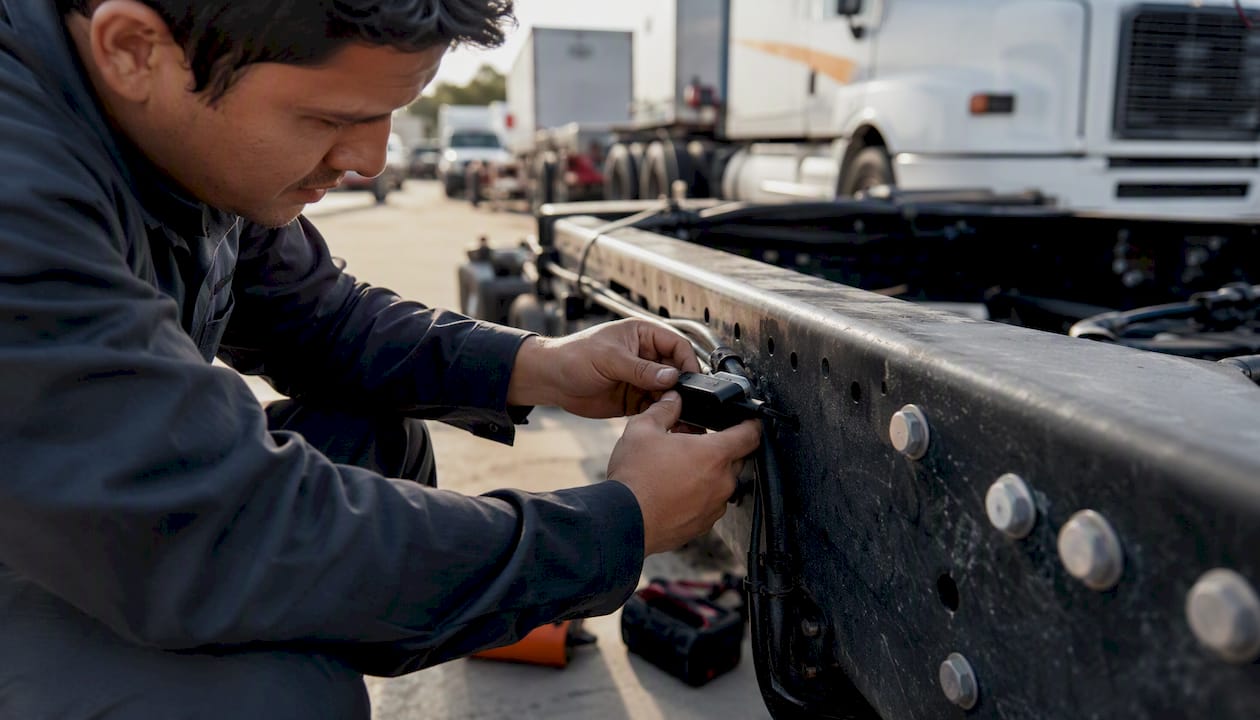
- Install hardware and integrate data feeds. For OBD-II vehicles, a plug-in device takes under five minutes. Hardwired CAN devices require a technician but deliver more stable data. Connect fuel-card feeds via API or CSV import.
- Collect a 30–60 day baseline. Do not set alerts during this period. Let the data establish normal ranges for each vehicle and route type.
- Set thresholds and activate alerts. Start with an 8–12% variance threshold. Refine after the first 30 days of alert data to reduce noise.
- Scale to the full fleet. Roll out the configuration that worked in the pilot, adjusting for vehicle-type differences.
Pro Tip: Make the pilot statistically useful by including at least one vehicle from each major duty cycle. A pilot of five identical highway trucks tells you nothing about your urban delivery vans.
For hardware budget planning: OBD-II plug-in devices typically run $30–$150 per unit for the hardware itself. Hardwired CAN devices are higher. Subscription-free GPS devices, like those from Motowatchdog, eliminate the ongoing per-vehicle fee that adds up across larger fleets.
How accurate is fuel consumption data, and what goes wrong?
No measurement method is perfect. Knowing the failure modes helps you build cross-checks into the system.
Common accuracy problems:
- Sensor drift: Flow meters and tank gauges lose calibration over time, especially in temperature extremes common in North American winters and summers.
- OEM ECM differences: Fuel-rate parameters vary across manufacturers. A value labeled “instantaneous fuel rate” on a Ford F-250 may be calculated differently than on a Freightliner Cascadia.
- Fuel-card vs. consumption mismatch: Cards record purchase volume, not consumption. A vehicle that fills up every three days will show a three-day lag between purchase and actual use.
- GNSS sampling gaps: Tunnels, urban canyons, and device sleep modes create position gaps that distort trip-model estimates.
- Temperature effects on fuel density: Diesel expands in heat, so a gallon purchased in Phoenix in July contains slightly less energy than one purchased in Minneapolis in January.
Best practices to maintain data quality:
- Schedule annual meter calibration and cross-check tank sensors against physical dip readings quarterly.
- Cross-validate ECM consumption against fuel-card purchases monthly. Persistent mismatches above 5% warrant investigation.
- Apply data-cleaning rules to flag GPS gaps longer than 60 seconds before feeding data into trip models.
- Involve drivers in the process. Drivers who understand what the system measures are less likely to game it and more likely to report sensor malfunctions.
Pro Tip: Before acting on a variance alert, check whether the vehicle had a route change, a load increase, or a recent fuel-card fill at a different pump. Validate the event against at least two data sources before escalating.
A 30–60 day baseline remains the standard for establishing meaningful thresholds. Once this period is complete, alerts should be triggered for deviations in the 8–12% range to balance sensitivity and avoid excessive false positives.
How do GNSS trip models estimate fuel without engine data?
For fleets without ECM access, trip-based estimation using GNSS speed profiles is a validated alternative. ISO 23795-1 specifies the method: extract a trip speed profile from GNSS data, compare it against reference driving-cycle energy values, and apply vehicle-specific correction factors to calculate per-trip fuel and CO2.
The SimpleFleet project (DLR) implemented this using the EWS formula, which applies vehicle-type constants (c0, c1, c2, cS, cY) to map-matched speed segments:
- Map-match raw GNSS trajectories to road network segments.
- Compute per-segment speed and road type (motorway, urban, rural).
- Apply EWS formula constants for the vehicle category to get grams of fuel per kilometer.
- Convert g/km to liters using fuel density (diesel: approximately 0.832 kg/L).
- Sum across all segments to get total trip fuel consumption.
| Algorithm step | Required inputs | Typical sources |
|---|---|---|
| Map-match trajectories | Raw GNSS coordinates, road network | GPS device, HERE/OpenStreetMap |
| Compute per-segment speed | Position timestamps, segment length | GNSS device |
| Apply EWS constants | Vehicle category, road type | Vehicle registration, map data |
| Convert g/km to liters | Fuel type, density constant | Fleet records |
| Sum per trip | All segment values | Platform aggregation |
GNSS trip models are appropriate for large-scale fleet analytics and older vehicles without accessible ECM ports. Expect accuracy within 10–15% of ECM-measured values under normal conditions. For compliance reporting that requires high precision, ECM-based readings remain the preferred source.
This approach works well for fleet-level trend analysis and benchmarking. It is less suited for individual-vehicle fraud detection, where the precision of ECM-based variance calculations is needed.
How Motowatchdog fits into a fuel monitoring program
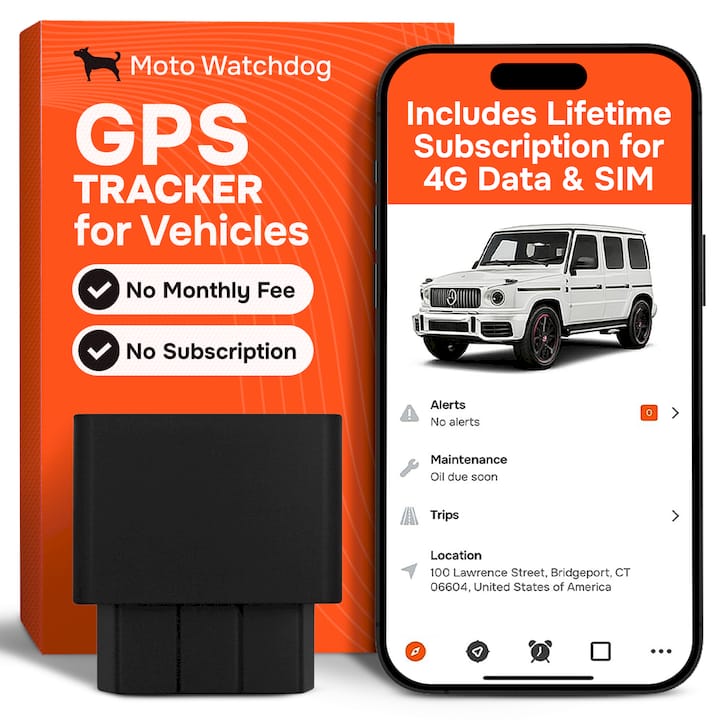
Motowatchdog’s subscription-free 4G GPS tracker provides the GNSS trip and mileage data layer that feeds directly into trip-based fuel estimation. The device records real-time location, trip history, mileage, idle time, and geofence events, all accessible through the mobile app with no monthly fee.
In a mixed monitoring strategy, Motowatchdog handles:
- Route and mileage verification: Confirms actual routes driven against planned routes for fuel variance analysis.
- Idle time tracking: Flags extended idle events via push alerts, supporting idle-reduction programs.
- Trip reporting: Exports trip data for GNSS-based fuel estimation or integration with fleet analytics platforms. The fleet tracking data export guide covers how to structure those exports.
- Geofencing alerts: Notifies managers when vehicles leave defined zones, a first-line fraud-detection signal.
The honest constraint: Motowatchdog devices do not read ECM fuel-rate parameters on their own. For instantaneous fuel rate and engine-level MPG, pairing the device with an OBD-II interface or a hardwired CAN connection is the path to engine-level data.
Motowatchdog’s subscription-free model removes the per-vehicle monthly cost that makes ECM-based telematics prohibitive for smaller fleets. For a 10-vehicle operation, eliminating a $20/month per-vehicle fee saves $2,400 annually, money that can fund the OBD hardware needed for deeper fuel metrics.
Pro Tip: Deploy Motowatchdog devices first to establish route baselines and identify your highest-mileage vehicles. Then prioritize OBD-II or hardwired CAN upgrades on those specific vehicles for ECM-level fuel data where it matters most.
The data-first approach most fleets skip
Most fleet managers who struggle with fuel monitoring programs have one thing in common: they set up dashboards before they have baseline data. A dashboard full of real-time numbers is not useful until you know what “normal” looks like for each vehicle and route. The 30–60 day baseline period is not a delay. It is the foundation that makes every alert meaningful.
The second mistake is treating fuel monitoring as a technology project rather than an operational one. The best sensor array in the industry produces no savings if drivers do not understand what is being measured or why. Involving drivers in the program from day one, sharing MPG benchmarks with them, and tying coaching to data rather than suspicion changes the dynamic entirely.
Start with two data sources, not one. A fuel card alone shows you what was purchased. A GPS device alone shows you where the vehicle went. Together, they show you whether what was purchased matches where the vehicle actually traveled. That cross-validation is where the real value lives.
Motowatchdog makes the GNSS layer affordable
Fuel monitoring programs often stall on hardware cost. Motowatchdog solves the GNSS data layer with a one-time device purchase and no recurring fees, which means your per-vehicle tracking cost stays fixed whether you run 5 vehicles or 50.
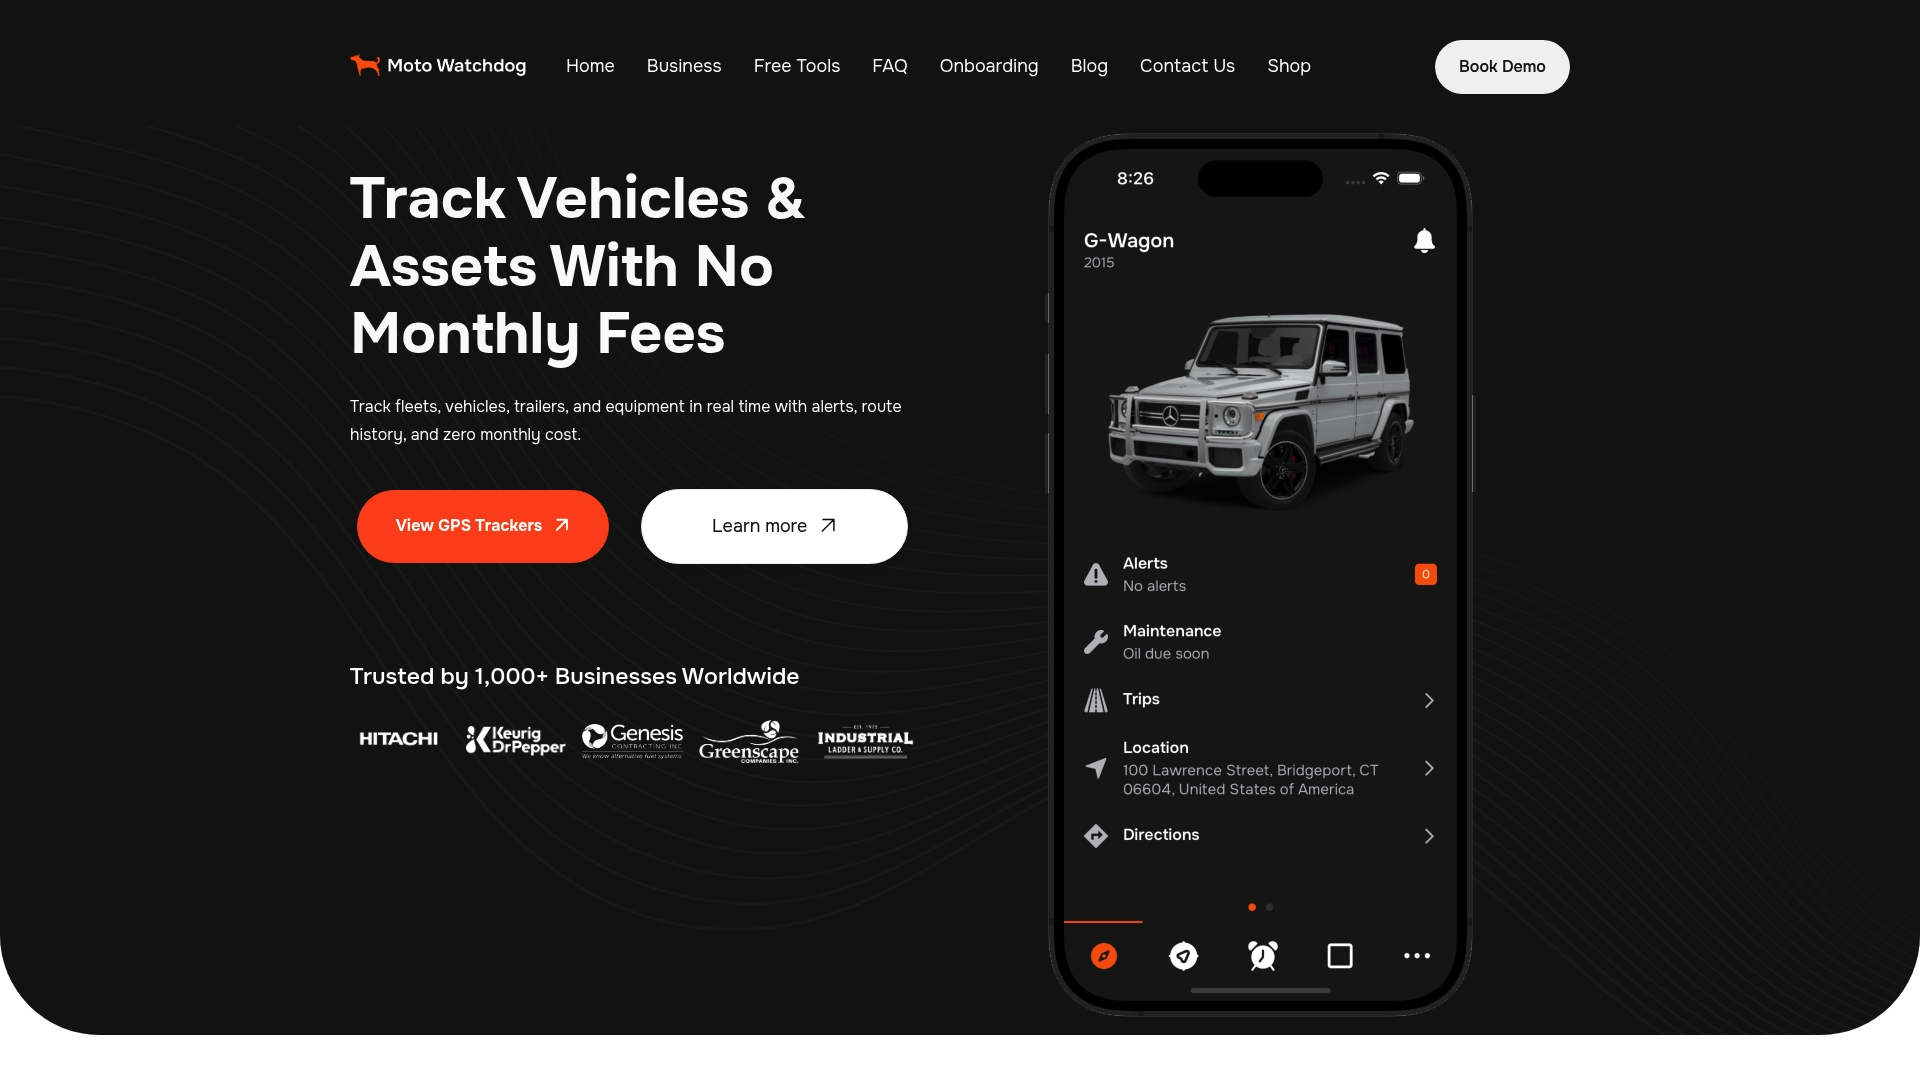
The device ships ready to deploy, records trip data from day one, and connects to the mobile app for real-time alerts and mileage exports. For fleets building toward a full monitoring stack, Motowatchdog provides the route and mileage foundation while you add ECM-level sensors on priority vehicles over time. Visit Motowatchdog’s product page to see device specs and order directly.
Sources
- 6 Ways To Track Fuel and Gain Insights - Penske Truck Leasing
- ISO 23795-1:2022 - Intelligent transport systems — Extracting trip data using nomadic and mobile devices for estimating CO2 emissions — Part 1: Fuel consumption determination for fleet management
- Fuel Management Systems Guide for Fleets
- SimpleFleet fuel consumption calculation (DLR / SimpleFleet project)
- Fleet Fuel Monitoring 101 | AtoB
- FORS Fuel Management Guide