
How to start saving money
Lorem ipsum dolor sit amet, consectetur adipiscing elit lobortis arcu enim urna adipiscing praesent velit viverra sit semper lorem eu cursus vel hendrerit elementum morbi curabitur etiam nibh justo, lorem aliquet donec sed sit mi dignissim at ante massa mattis.
- Neque sodales ut etiam sit amet nisl purus non tellus orci ac auctor
- Adipiscing elit ut aliquam purus sit amet viverra suspendisse potent
- Mauris commodo quis imperdiet massa tincidunt nunc pulvinar
- Excepteur sint occaecat cupidatat non proident sunt in culpa qui officia
Why it is important to start saving
Vitae congue eu consequat ac felis placerat vestibulum lectus mauris ultrices cursus sit amet dictum sit amet justo donec enim diam porttitor lacus luctus accumsan tortor posuere praesent tristique magna sit amet purus gravida quis blandit turpis.

How much money should I save?
At risus viverra adipiscing at in tellus integer feugiat nisl pretium fusce id velit ut tortor sagittis orci a scelerisque purus semper eget at lectus urna duis convallis. porta nibh venenatis cras sed felis eget neque laoreet suspendisse interdum consectetur libero id faucibus nisl donec pretium vulputate sapien nec sagittis aliquam nunc lobortis mattis aliquam faucibus purus in.
- Neque sodales ut etiam sit amet nisl purus non tellus orci ac auctor
- Adipiscing elit ut aliquam purus sit amet viverra suspendisse potenti
- Mauris commodo quis imperdiet massa tincidunt nunc pulvinar
- Adipiscing elit ut aliquam purus sit amet viverra suspendisse potenti
What percentege of my income should go to savings?
Nisi quis eleifend quam adipiscing vitae aliquet bibendum enim facilisis gravida neque. Velit euismod in pellentesque massa placerat volutpat lacus laoreet non curabitur gravida odio aenean sed adipiscing diam donec adipiscing tristique risus. amet est placerat in egestas erat imperdiet sed euismod nisi.
“Nisi quis eleifend quam adipiscing vitae aliquet bibendum enim facilisis gravida neque velit euismod in pellentesque”
Do you have any comments? Share them with us on social media
Eget lorem dolor sed viverra ipsum nunc aliquet bibendum felis donec et odio pellentesque diam volutpat commodo sed egestas aliquam sem fringilla ut morbi tincidunt augue interdum velit euismod eu tincidunt tortor aliquam nulla facilisi aenean sed adipiscing diam donec adipiscing ut lectus arcu bibendum at varius vel pharetra nibh venenatis cras sed felis eget.
Fleet size scalability is the ability to increase your fleet’s vehicle count and operational throughput without proportional increases in cost per mile, administrative overhead, or unplanned downtime. If you can add ten vehicles without hiring two more coordinators and without watching your maintenance costs spike, your fleet is scalable. If you cannot, you have a structural problem worth solving before your next growth wave.
Before reading further, run this 24–72 hour baseline check:
- Verify your Peak Vehicle Requirement (PVR): count the maximum vehicles you need simultaneously at peak demand, then calculate your spare ratio (industry planning rule: 10–20% of active vehicles held in reserve for maintenance and breakdowns).
- Confirm telematics coverage: identify which vehicles have real-time GPS data and which are blind spots. Motowatchdog’s subscription-free GPS devices are one option for closing coverage gaps quickly.
- Select a pilot group: choose 5–15 vehicles on a single route or depot to test any new system before fleet-wide rollout.
- Record current KPIs: utilization rate, downtime hours, and cost per mile. These numbers are your baseline; without them, you cannot measure whether scaling is working.
Key Takeaways
Fleet size scalability is the ability to grow vehicle count and throughput without proportional increases in cost, downtime, or administrative overhead, and it requires clean data, phased technology adoption, and disciplined KPI tracking before any procurement decision.
| Point | Details |
|---|---|
| Define scalability precisely | Fleet size scalability means adding capacity without proportional cost, downtime, or admin increases. |
| Size with PVR and spare ratio | Calculate PVR first, then add a 10–20% spare ratio; use newsvendor models when demand is highly variable. |
| Sequence technology adoption | Deploy telematics and PM automation before FMS scheduling changes to avoid data gaps during rollout. |
| Track the right KPIs daily | Monitor utilization, downtime, and PM compliance daily; cost per mile and SLA monthly. |
| Motowatchdog for pilot phases | Subscription-free GPS devices give real-time utilization and mileage data with no recurring per-vehicle fees. |
Table of Contents
- What fleet size scalability means for your operations
- Core technologies that make fleet growth manageable
- How to implement scalable systems without disrupting operations
- How to decide the right fleet size: PVR, spare ratio, and formal models
- Cost trade-offs: buy, lease, rent, or mix
- Key performance indicators to monitor when scaling
- Common mistakes when scaling fleet size and how to avoid them
- A phased rollout checklist for scaling without disruption
- How subscription-free GPS tracking supports scalable fleets
- Motowatchdog helps your fleet scale without subscription overhead
- Sources
What fleet size scalability means for your operations
Fleet size scalability is not simply “buying more trucks.” It is a measurable operational capability. A fleet that scales well adds capacity in response to demand without triggering a cascade of new problems: administrative bottlenecks, maintenance backlogs, or degraded service levels.
The benefits are concrete. Higher utilization means each vehicle earns more revenue per day. Better spare-ratio management reduces the capital sitting idle in reserve. Predictable operating expenses let you bid contracts with confidence. Scalable fleet management solutions centralize data and automate workflows so that adding vehicles or service areas does not require proportional increases in staff or coordination effort.
The risks of scaling poorly are just as concrete. Undersize your fleet and you miss SLAs, pay emergency rental rates, and erode customer trust. Oversize it and you carry stranded capital in vehicles that sit unused. The administrative tipping point is real: many fleet managers report that somewhere between 15 and 30 vehicles, manual spreadsheet tracking collapses under its own weight.
Three business triggers typically force the scalability conversation:
- Sustained utilization above 85%: vehicles running near capacity leave no buffer for breakdowns or demand spikes.
- Recurring rental spend: when monthly rental costs approach or exceed a lease payment, ownership or leasing deserves a fresh look.
- New contract wins or service-area expansion: adding a depot or a new geographic zone almost always exposes infrastructure gaps that were invisible at smaller scale.
A small delivery operator that grew from 8 to 22 vehicles in one season discovered its spare ratio had dropped from 18% to 6% without anyone noticing, because no system was tracking it. A contractor fleet that was spending $4,200 per month on short-term rentals found that a 36-month lease on two additional vehicles cost $2,800 per month total, with lower per-mile maintenance costs included.
Core technologies that make fleet growth manageable
Scaling without the right technology is how fleets end up with 40 vehicles and the administrative chaos of 80. The building blocks below are listed in priority order for most North American fleets.
- Fleet Management System (FMS): the central asset registry. An enterprise-grade FMS must support bulk imports, robust analytics, and API integrations to remain operationally scalable. Without it, every new vehicle is a manual data entry problem.
- Telematics and GPS tracking: real-time location, idle-time monitoring, and mileage data feed every other system. Motowatchdog’s subscription-free devices give fleet managers a one-time hardware cost with no recurring fees, making them practical for pilots and for fleets watching working capital. See the fleet GPS data integration guide for how telematics data connects to FMS and maintenance platforms.
- Route optimization and dispatch tools: reduce the number of vehicles needed to serve the same demand. Fewer required vehicles means a lower PVR and a smaller spare pool.
- Predictive maintenance and automated PM scheduling: digitizing maintenance before expanding fleet size reduces unplanned breakdowns and lowers per-vehicle maintenance costs, according to vendor reporting on delivery operations.
- Data integration and APIs: telematics data that stays siloed in a tracking app adds limited value. Feeding it to your ERP, maintenance platform, and BI dashboards is what turns raw location data into cost-per-mile intelligence.
- AI and demand forecasting: at larger scale, machine-learning models can predict daily vehicle demand by route and depot, enabling dynamic assignment and reducing spare-ratio waste.
How to implement scalable systems without disrupting operations
The most common scaling mistake is attempting too many technology changes at once. Industry reporting confirms that phased rollouts and internalizing key functions reduce downtime, while deferred maintenance can push emergency-repair costs significantly higher than planned work.
Assess before you buy. Map your current data readiness: which vehicles have telematics, which maintenance records are digital, and where your dispatchers are still working from whiteboards. Gaps here will undermine any new system you install on top of them.
Sequence the rollout deliberately. Telematics and PM automation should come before enterprise scheduling changes. If your maintenance data is incomplete, your scheduling system will make decisions on bad inputs.
Assign a single rollout owner. Change management without a named owner produces committees and delays. One person holds the implementation timeline, the SOP update log, and the training calendar.
Pro Tip: Run telematics and PM automation for at least four weeks on your pilot group before touching dispatch or routing software. The data you collect in that window will reveal scheduling assumptions that were never written down.
The change-management checklist for each phase:
- Update SOPs before training, not after.
- Define data governance rules (who edits vehicle records, who approves PM deferrals) before go-live.
- Set rollback triggers in writing: if PM compliance drops below 80% or emergency repairs spike more than 20% above baseline, pause the rollout and diagnose.
How to decide the right fleet size: PVR, spare ratio, and formal models
Sizing a fleet correctly is part formula, part judgment, and part model. Here are the methods in order of complexity.
-
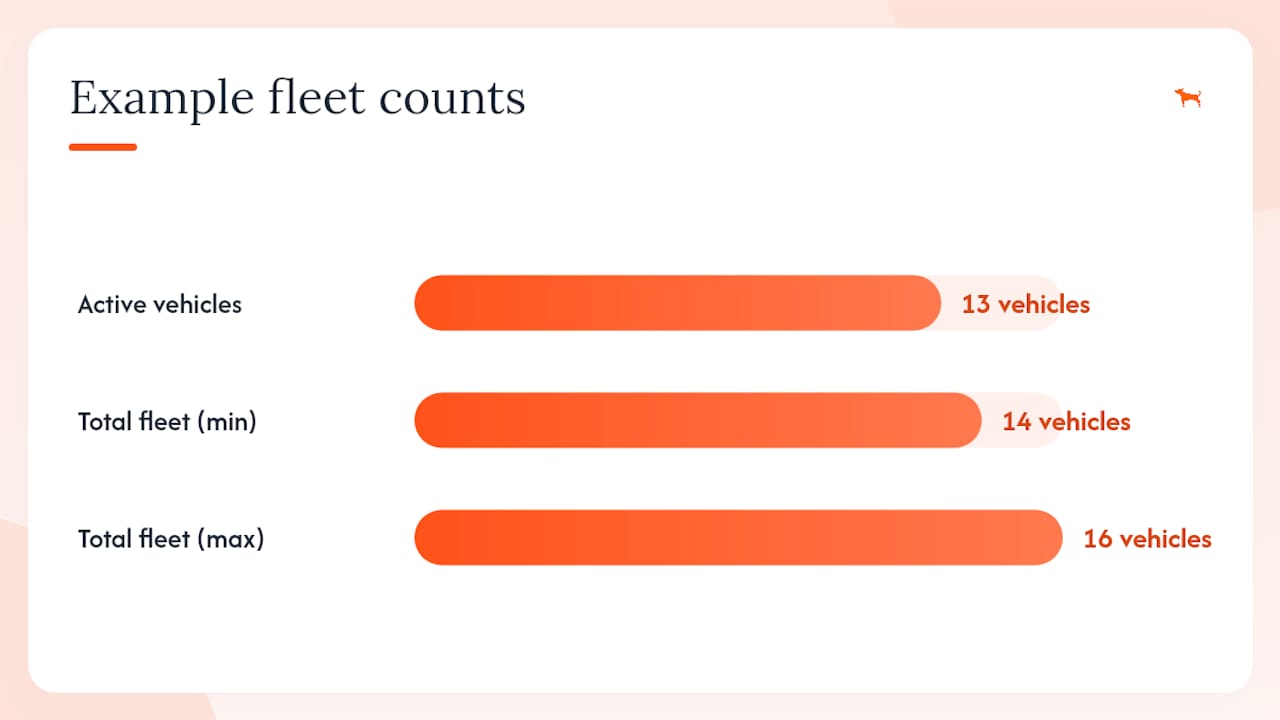
Peak Vehicle Requirement (PVR). The foundational formula: PVR = Daily Demand ÷ Vehicle Capacity × (Cycle Time ÷ Operating Time). If you serve 200 stops per day, each vehicle handles 20 stops, your cycle time is 10 hours, and you operate 8 hours, PVR = 200 ÷ 20 × (10 ÷ 8) = 12.5, so 13 active vehicles. Fleet size planning guides recommend adding a spare ratio on top of PVR, giving you 14–16 total vehicles in this example.
-
Spare ratio calculation. Spare Ratio = (Total Fleet Size − Active Vehicles) ÷ Total Fleet Size. A ratio below 10% leaves you exposed to any maintenance event. Above 20%, you are carrying idle capital. The right number depends on your vehicle age, maintenance maturity, and demand variability.
-
Newsvendor framing for tactical daily sizing. For fleets with high demand variability (on-demand delivery, ridepooling, seasonal logistics), a newsvendor-style model frames the daily fleet-size decision as a trade-off between the fixed cost of deploying an additional vehicle and the per-unit penalty for an unserved request. Continuous approximations make the total-cost function convex, meaning there is a mathematically efficient optimal fleet size for each demand scenario. This approach is particularly useful when demand distributions are known from historical data.
-
Scale effects in on-demand services. Research on ridepooling systems identifies three interacting effects: the Mohring effect (more vehicles reduce wait times), the better-matching effect (larger fleets improve trip consolidation), and the extra-detour effect (pooling adds route length). Scale economies often prevail, but the net outcome depends on demand density and routing behavior. Fleets operating on-demand or shared-ride models should account for all three.
-
When to use each method. Rules of thumb (PVR + spare ratio) work for stable, predictable demand. The newsvendor model fits high-variability services where demand distributions can be estimated from 90+ days of historical data. Simulation is the right tool when you have multiple depots, complex routing constraints, or significant uncertainty in service time distributions.
Pro Tip: Before committing to a procurement decision based on any model, run a short rolling-horizon simulation using 30 days of actual request data. Model outputs are only as good as the demand distribution you feed them.
Data inputs required for advanced models: historical request distributions by time of day and day of week, route-level linehaul time estimates, service time distributions per stop type, depot locations and capacity, and delay or error margins from your current operations.
Cost trade-offs: buy, lease, rent, or mix
Choosing how to fund fleet growth affects working capital, maintenance responsibility, and balance-sheet flexibility. Leasing often preserves working capital and can be preferable when frequent turnover, seasonal demand, or balance-sheet flexibility is required.
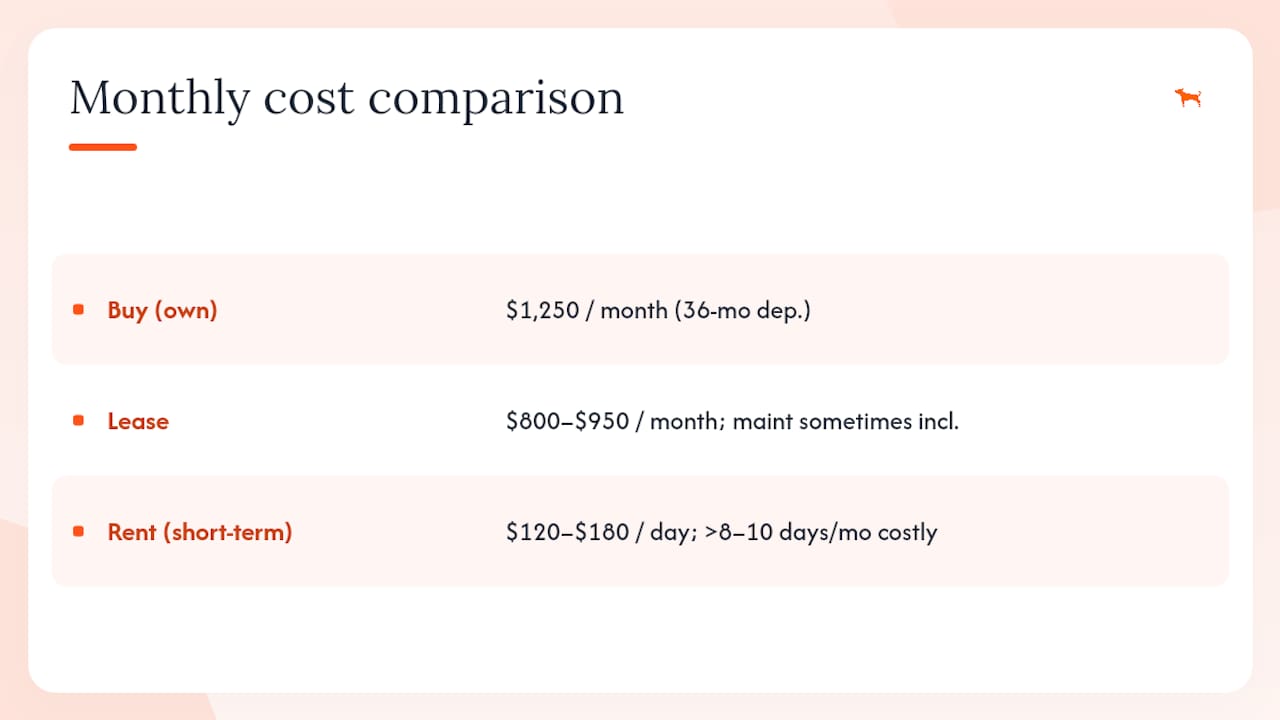
A practical comparison: a work van purchased outright at $45,000 costs roughly $1,250 per month over a 36-month depreciation horizon (excluding maintenance). A lease on the same vehicle might run $800–$950 per month with maintenance included in some contracts. A short-term rental at $120–$180 per day becomes more expensive than a lease after roughly 8–10 days per month of use. The break-even point is the signal to stop renting and start leasing.
Crowdsourced and contractor driver models offer a third path when regulatory or license caps limit direct hiring. They provide temporal scale without capital commitment, though they introduce compliance and quality-control considerations that require their own management layer.
Key performance indicators to monitor when scaling
Tracking the right KPIs is what separates a managed growth process from an expensive experiment. Set these up before you add vehicles, not after.
- Utilization rate: active vehicle hours ÷ available vehicle hours. Target 75–85% for most commercial fleets; above 90% signals under-capacity.
- Spare ratio: (total fleet − active vehicles) ÷ total fleet. Monitor monthly; act if it drops below 10%.
- Peak Vehicle Requirement (PVR): recalculate quarterly as demand patterns shift.
- Unplanned repairs per 1,000 miles: the leading indicator of maintenance maturity. Declining numbers confirm PM automation is working.
- Cost per mile: total operating cost ÷ total miles driven. Track monthly; compare by vehicle class and age.
- First-time fix rate: percentage of repairs completed without a return visit. Below 70% signals parts availability or technician training gaps.
- SLA hit rate and on-time delivery: the customer-facing output of all the above. If utilization and downtime look good but SLA is slipping, the problem is usually routing or dispatch.
Suggested monitoring cadence: utilization and downtime daily, utilization trends and service level weekly, cost-per-mile and total cost of ownership monthly. Assign a named owner to each KPI. A metric without an owner does not get acted on.
Common mistakes when scaling fleet size and how to avoid them
Adding vehicles without systems. Every vehicle added to a spreadsheet-managed fleet increases administrative load nonlinearly. Implement your FMS and bulk-import templates before the procurement order, not after delivery.
Underestimating maintenance lead times. Parts for newer vehicle models can have 2–6 week lead times. A spare ratio that looks adequate on paper collapses when three vehicles are waiting on the same part. Build a critical-parts register and set reorder thresholds before you scale.
Big-bang technology rollouts. Deploying FMS, telematics, route optimization, and a new dispatch system simultaneously is a reliable way to disrupt operations for months. Pilot one system, stabilize it, then add the next.
Ignoring seasonal demand patterns. A fleet sized for peak December demand will carry 20–30% idle capacity in February. Build temporal capacity through short-term rentals or flex drivers for peak periods, and size your owned or leased fleet for your reliable baseline demand.
Skipping GPS safety and compliance tracking. Scaling without visibility into driver behavior and vehicle location creates liability exposure. The GPS fleet safety guide covers how real-time tracking reduces incident rates and supports compliance documentation.
A phased rollout checklist for scaling without disruption
Pilot phase (weeks 1–8)
- Select 5–15 vehicles on one route or depot.
- Install telematics and enable PM automation on all pilot vehicles.
- Record baseline KPIs: utilization, downtime, cost per mile, PM compliance.
- Document operational friction points (manual steps, data gaps, dispatch workarounds).
- Success criteria: telematics data complete for 95%+ of trips, PM compliance above 80%.
Stabilize and expand phase (months 2–4)
- Refine SOPs based on pilot findings.
- Train dispatchers, technicians, and depot managers on updated workflows.
- Add depot-level dashboards and assign KPI owners.
- Evaluate lease vs. rental vs. purchase for the next vehicle tranche based on pilot utilization data.
- Success criteria: PM compliance above 90%, unplanned downtime trending down week-over-week.
Scale phase (months 6–12)
- Bulk import all remaining assets into FMS using validated templates.
- Automate reporting for utilization, cost per mile, and SLA.
- Lock supplier and parts agreements at volume pricing.
- Integrate telematics data with ERP and maintenance platforms via API.
- Success criteria: cost per mile stable or improving, SLA hit rate steady at or above target.
Rollback triggers: if PM compliance drops below 80% at any phase, or emergency repairs spike more than 20% above the pilot baseline, pause expansion and diagnose before proceeding.
How subscription-free GPS tracking supports scalable fleets
Motowatchdog’s subscription-free GPS devices offer a practical example of how tracking technology maps to the KPIs and rollout steps described above. Because the cost model is a one-time hardware purchase with no monthly fees, fleet managers can onboard devices during the pilot phase without committing to per-vehicle recurring charges that compound as the fleet grows.
In practice, this means:
- Faster onboarding: devices can be installed quickly using OBD-II ports or hardwired configurations. The hardwiring guide for fleet managers covers both installation paths for different vehicle types.
- Reliable mileage data: automated trip and mileage reporting feeds directly into cost-per-mile calculations and TCO tracking, two of the core KPIs for scaling decisions.
- PM scheduling support: maintenance reminder features help enforce PM intervals across a growing vehicle count without requiring a separate maintenance platform in the pilot phase.
- Geofencing and idle-time alerts: geofence notifications and idle-time data improve utilization reporting accuracy, which is the first metric to verify when assessing whether a fleet is ready to grow.
Motowatchdog is one applied example of a scalable tracking component. Fleet managers should evaluate fit based on their vehicle types, data integration requirements, and existing FMS infrastructure. The subscription-free GPS guide for businesses provides a detailed breakdown of the cost model and feature set.
A practical perspective on fleet scalability priorities
Most fleet managers who struggle with scaling have the same root problem: they try to grow the fleet before they have reliable data about the fleet they already operate. Utilization numbers that come from driver logs rather than telematics are estimates at best. Maintenance records kept in spreadsheets miss patterns that a PM automation system would catch in the first month.
The priority order that consistently produces better outcomes is straightforward. First, get clean data: deploy telematics on every vehicle and digitize maintenance records. Second, automate PM scheduling before adding a single new vehicle. Third, run a pilot with a small group, measure KPIs for 4–8 weeks, and let the data tell you whether your systems can handle growth before your procurement order does.
The newsvendor framing for fleet sizing is genuinely useful, but only when you have 90 or more days of clean demand data to feed it. Most fleets that think they need a sophisticated model actually need better data collection first. The model is the last step, not the first.
Three things worth implementing this quarter: set up daily utilization and downtime tracking with named KPI owners, run a PM compliance audit on your current fleet, and identify the one route or depot where a 5-vehicle pilot would give you the most representative data for your growth plans.
Motowatchdog helps your fleet scale without subscription overhead
Fleet managers scaling from 10 to 50 vehicles face a specific cost problem: per-vehicle tracking fees that compound monthly. Motowatchdog eliminates that compounding cost entirely. One hardware purchase per vehicle, no recurring fees, and real-time GPS data from day one.
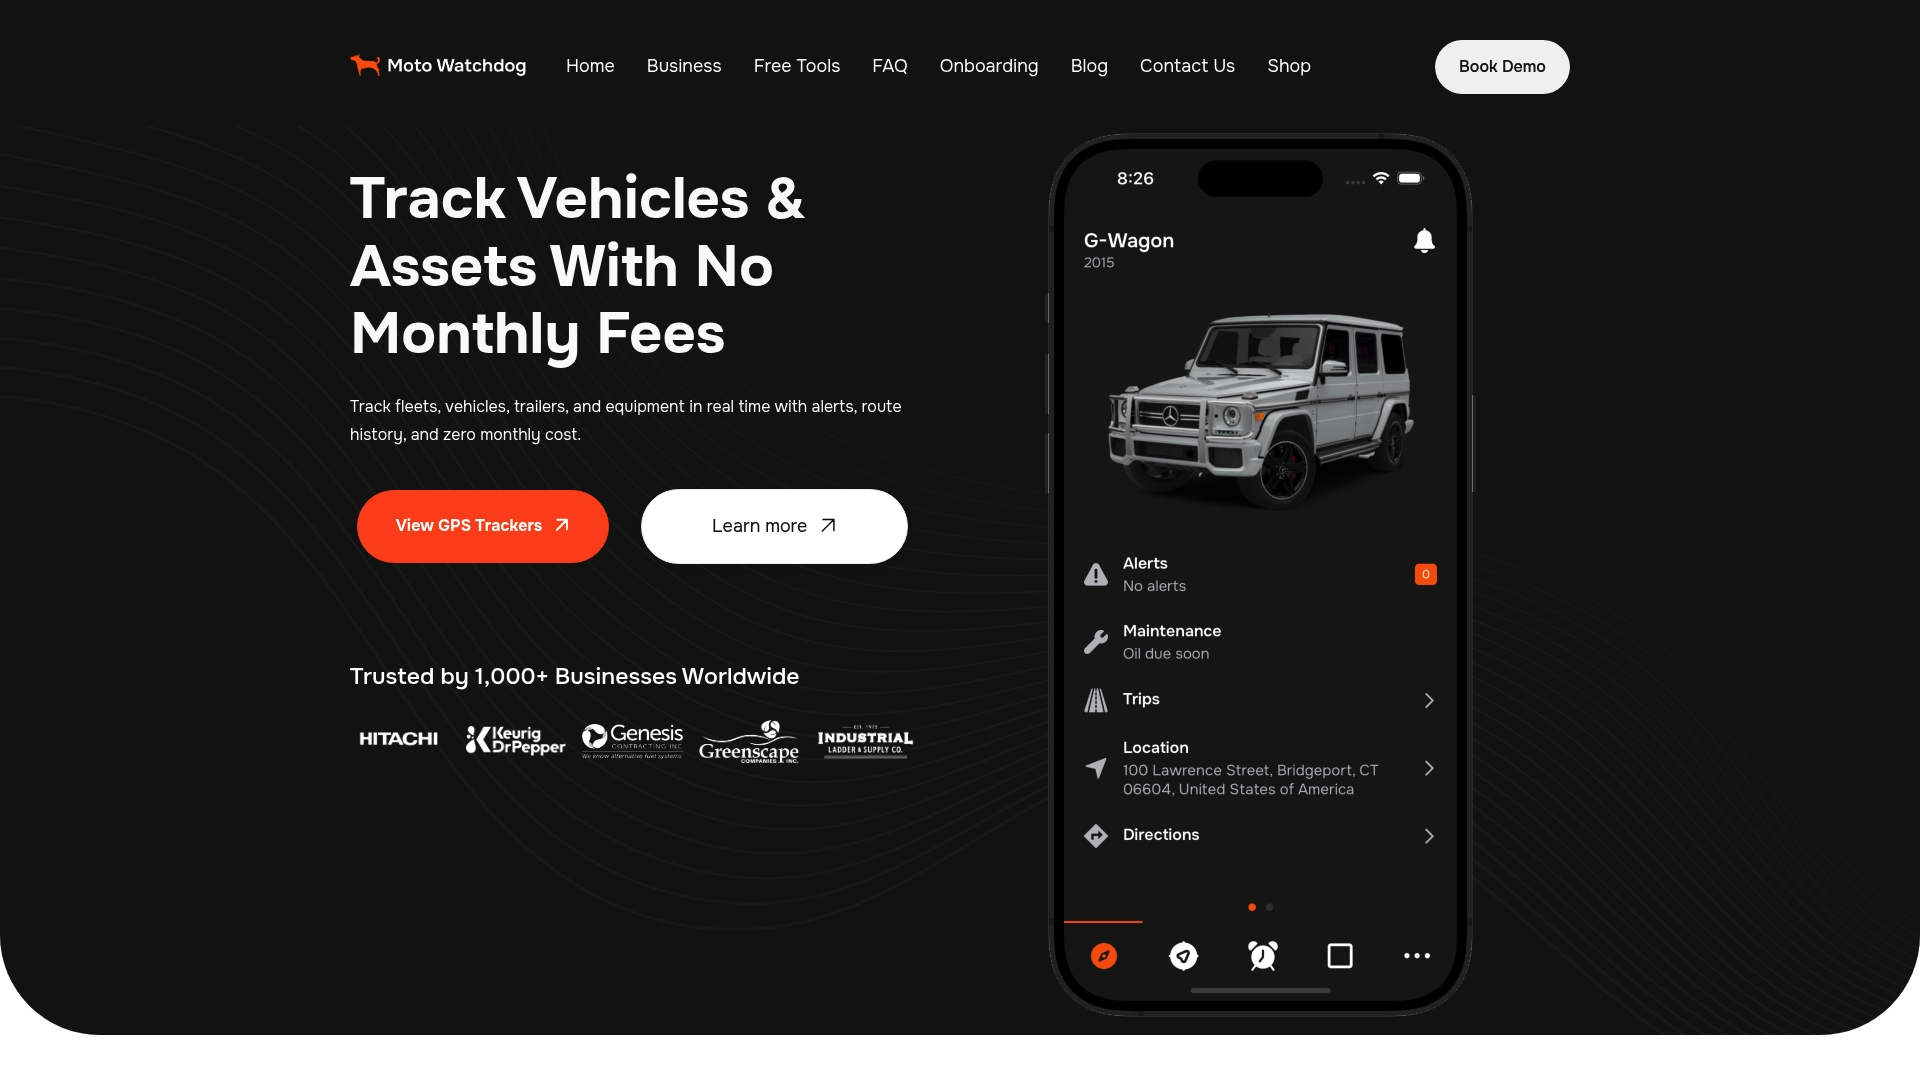
The features that matter most during a scaling phase are exactly what Motowatchdog delivers: real-time location for utilization tracking, geofencing alerts for operational boundaries, mileage reporting for cost-per-mile calculations, and maintenance reminders to keep PM compliance above 90% as your vehicle count grows. The companion app manages multiple devices from a single interface, so your administrative load stays flat even as the fleet expands.
For managers ready to run a pilot, the Motowatchdog GPS tracker is available for direct purchase with no contract commitment. Start with 5–10 devices on your highest-utilization route, measure the KPI impact over 4–8 weeks, and scale from there.
Sources
- Scaling Smart: How Fleet Operations Can Cut Downtime and Drive Growth | Metro
- A Newsvendor Model for Last-Mile Fleet Sizing
- Scaling a Commercial Vehicle Fleet: The 2026 Strategic Growth Framework
- How Delivery Companies Scale Operations Without Increasing Downtime
- What is fleet size? Guide for transportation and logistics
- Scalable Fleet Management Solutions to Grow Your Business
- Scale economies in on-demand ridepooling systems