
How to start saving money
Lorem ipsum dolor sit amet, consectetur adipiscing elit lobortis arcu enim urna adipiscing praesent velit viverra sit semper lorem eu cursus vel hendrerit elementum morbi curabitur etiam nibh justo, lorem aliquet donec sed sit mi dignissim at ante massa mattis.
- Neque sodales ut etiam sit amet nisl purus non tellus orci ac auctor
- Adipiscing elit ut aliquam purus sit amet viverra suspendisse potent
- Mauris commodo quis imperdiet massa tincidunt nunc pulvinar
- Excepteur sint occaecat cupidatat non proident sunt in culpa qui officia
Why it is important to start saving
Vitae congue eu consequat ac felis placerat vestibulum lectus mauris ultrices cursus sit amet dictum sit amet justo donec enim diam porttitor lacus luctus accumsan tortor posuere praesent tristique magna sit amet purus gravida quis blandit turpis.

How much money should I save?
At risus viverra adipiscing at in tellus integer feugiat nisl pretium fusce id velit ut tortor sagittis orci a scelerisque purus semper eget at lectus urna duis convallis. porta nibh venenatis cras sed felis eget neque laoreet suspendisse interdum consectetur libero id faucibus nisl donec pretium vulputate sapien nec sagittis aliquam nunc lobortis mattis aliquam faucibus purus in.
- Neque sodales ut etiam sit amet nisl purus non tellus orci ac auctor
- Adipiscing elit ut aliquam purus sit amet viverra suspendisse potenti
- Mauris commodo quis imperdiet massa tincidunt nunc pulvinar
- Adipiscing elit ut aliquam purus sit amet viverra suspendisse potenti
What percentege of my income should go to savings?
Nisi quis eleifend quam adipiscing vitae aliquet bibendum enim facilisis gravida neque. Velit euismod in pellentesque massa placerat volutpat lacus laoreet non curabitur gravida odio aenean sed adipiscing diam donec adipiscing tristique risus. amet est placerat in egestas erat imperdiet sed euismod nisi.
“Nisi quis eleifend quam adipiscing vitae aliquet bibendum enim facilisis gravida neque velit euismod in pellentesque”
Do you have any comments? Share them with us on social media
Eget lorem dolor sed viverra ipsum nunc aliquet bibendum felis donec et odio pellentesque diam volutpat commodo sed egestas aliquam sem fringilla ut morbi tincidunt augue interdum velit euismod eu tincidunt tortor aliquam nulla facilisi aenean sed adipiscing diam donec adipiscing ut lectus arcu bibendum at varius vel pharetra nibh venenatis cras sed felis eget.
Tracking fleet emissions reduces fuel costs, protects against regulatory fines, and keeps your fleet eligible for contracts that require verified Scope 1 data. Those three outcomes alone make emissions monitoring one of the highest-return investments a fleet manager can make in 2026. The GHG Protocol’s Scope 1 framework, EPA guidance, and California Air Resources Board (CARB) standards all point to the same operational reality: fleets that measure emissions can manage them, and fleets that manage them spend less and win more business.
The immediate benefits worth knowing up front:
- Fuel cost reduction: Active emissions-reduction programs deliver verifiable fuel cost savings: fleets report reductions in the 12–18% range within 6–12 months of implementation.
- Audit-ready Scope 1 reporting: Reconciled fuel-card and telematics data satisfies procurement and regulatory verification requests.
- Lower aftertreatment failures: Monitoring DPF regen cycles and DEF schedules prevents the most common and costly enforcement issues.
- Tender eligibility: Major shippers and Fortune 500 customers increasingly require defensible emissions data during carrier onboarding and RFPs.
Table of Contents
- Why tracking fleet emissions is a business priority
- Which KPIs actually matter for fleet emissions?
- How does emissions tracking actually work in practice?
- Step-by-step path from zero data to an audited program
- Operational tactics that cut emissions once you’re measuring
- How to calculate ROI and produce audit-ready reports
- Driver consent, privacy, and legal requirements in North America
- Research evidence: what the studies actually show
- Key Takeaways
- The operational asset most fleets are still treating as a chore
- Motowatchdog makes the pilot phase easier and cheaper
- Useful sources and further reading
Why tracking fleet emissions is a business priority
The case for emissions monitoring goes well beyond environmental responsibility. Fuel is typically the largest variable cost in a fleet operation, and real-time vehicle tracking exposes idling, unauthorized use, and inefficient routing fast enough to affect the next billing cycle. That speed of feedback is what separates telematics-driven programs from manual reporting exercises.
Regulatory and inspection risk is growing at the state level even as federal rules shift. CARB standards, state enforcement programs, and the 2027 Heavy-Duty Low-NOx rule create real compliance obligations. Aftertreatment tampering and missing maintenance records drive the highest fines and inspection failures. Fleets with documented monitoring programs are in a much stronger position during roadside or agency inspections.
Procurement pressure is the factor most fleet managers underestimate. Carbon emissions reporting has moved from a voluntary PR exercise to a procurement-level requirement. Carriers that cannot produce verified Scope 1 figures risk losing contracts to competitors who can. That makes emissions tracking a revenue-protection capability, not just a compliance checkbox.
On the P&L, the savings appear in two places: fuel spend and maintenance. Reduced idling cuts fuel burn directly. Preventive maintenance triggered by telematics data reduces unplanned downtime and extends aftertreatment component life. Both show up within a single quarter when a program is run properly.
Which KPIs actually matter for fleet emissions?
Defensible Scope 1 reporting and an effective reduction program both require the same core set of metrics. Tracking too many creates noise; tracking too few leaves gaps auditors will flag.
| KPI | Why it matters | Primary data source |
|---|---|---|
| Total fuel consumed (by fuel type) | Foundation of every Scope 1 calculation | Fuel card transactions |
| Vehicle miles traveled (VMT) | Normalizes emissions for intensity metrics | Telematics odometer |
| Idle hours and gallons per idle hour | Quantifies the largest controllable waste source | Telematics engine data |
| — | Flags underperforming vehicles and drivers | Telematics + fuel card |
| CO2 per mile | Core intensity metric for customer reporting | Calculated from fuel + VMT + EPA factors |
| CO2 per ton-mile (freight) | Required for shipper-facing sustainability reports | Fuel + VMT + load data |

Intensity metrics (CO2 per mile, CO2 per ton-mile) matter most when you are reporting to customers or benchmarking against industry standards. Absolute emissions figures are what regulators and GHG Protocol auditors want. You need both.
Data quality depends on three inputs working together: fuel-card transactions, telematics mileage and fuel burn, and EPA or GREET emissions factors applied per fuel type. When those three sources reconcile to within 3% variance, the resulting figures will hold up to third-party verification.
How does emissions tracking actually work in practice?
Four data sources form the foundation of any fleet emissions program, and the best programs combine at least two of them.
- GPS/telematics with OBD-II or CAN integration: Highest accuracy for fuel burn and mileage. An OBD GPS tracker reads engine data directly, giving you fuel consumption per trip alongside location and idle time. This is the preferred method for fleets where device installation is feasible.
- Fuel-card reconciliation: Captures every gallon purchased and ties it to a vehicle and date. When matched against telematics odometer readings, it produces a transaction-level audit trail that satisfies most procurement verification requests.
- Manufacturer cloud data: Some OEM telematics platforms expose fuel and mileage data via API. Useful for newer vehicles but often locked to a single brand, which creates gaps in mixed fleets.
- Modeled approaches: Apply EPA GHG Emission Factors Hub or GREET emission factors to odometer readings and fuel types when hardware access is limited. Less accurate but acceptable for initial baselines.
Emission factors convert gallons consumed into CO2 equivalent. The EPA GHG Emission Factors Hub publishes annual updates by fuel type; GREET (from Argonne National Laboratory) provides lifecycle factors for alternative fuels. Always document which version of a factor set you used, because auditors ask.
Pro Tip: The fastest accuracy gain comes from pairing fuel-card reconciliation with telematics odometer data. That combination catches both purchase-side discrepancies and mileage gaps without requiring full CAN integration on every vehicle. Start there before investing in deeper OBD data streams.
Reconciliation discipline matters as much as the data sources. Match card transactions to vehicle assignments and telematics periods on a monthly basis. Flag any variance above 3% for investigation before it compounds into a quarterly reporting error.
Step-by-step path from zero data to an audited program
A structured three-phase rollout keeps the program manageable and produces measurable results within 12 months.
-
Phase 1 (months 0–3): Establish the baseline. Collect fuel-card transactions, telematics records, and odometer readings for 90 days. Define your reporting boundary: operational control is the standard GHG Protocol approach for most fleets. Assign an emissions program owner and document your methodology before you start calculating anything.
-
Phase 2 (months 3–6): Run a pilot. Select a representative subset of 10–20 vehicles across your most common duty cycles. Test telematics and fuel-card reconciliation together. Set initial KPIs (idle hours per vehicle per week, MPG by vehicle class, CO2 per mile) and establish variance thresholds. A small fleet tracking approach works well here: keep the pilot lean, validate the data, then scale.
-
Phase 3 (months 6–12): Scale and automate. Deploy devices or integrations across the full fleet. Automate reconciliation workflows so monthly closes happen without manual data pulls. Set a quarterly reconciliation cadence with documented exception workflows for variances above 3%.
Governance is what keeps a program credible over time. The program owner schedules quarterly reconciliations, investigates exceptions, updates emission factor versions annually, and maintains a methodology document that a third-party verifier can follow. Without that document, even accurate data becomes difficult to defend.
Key checklist items for each phase:
- Phase 1: fuel-card data export, telematics odometer pull, boundary definition, methodology draft
- Phase 2: pilot vehicle selection, KPI baseline, first reconciliation, variance log
- Phase 3: full deployment, automated reporting, quarterly cadence, third-party readiness review
Operational tactics that cut emissions once you’re measuring
Measurement without action is just record-keeping. These four interventions deliver the largest reductions once your data infrastructure is in place.
Route optimization and load balancing can reduce emissions by roughly 15–25% by eliminating unnecessary miles compared with manual dispatch planning. Algorithmic routing tools use telematics location data as their primary input, so the GPS investment that powers your emissions program also powers the optimization that reduces it.

Idle reduction programs address one of the most controllable waste sources in any fleet. Long-haul trucks idle over 2,000 hours per year, burning roughly 0.46–0.65 gallons per hour at idle. A structured program combining telemetry alerts, driver coaching, and auxiliary power unit (APU) strategies can recover a significant portion of that fuel spend. Driver behavior modification programs pay for themselves quickly when paired with consistent feedback and recognition.
Aftertreatment health monitoring prevents the most expensive compliance failures. Tracking DPF regen frequency, DEF refill intervals, and fault codes through telematics lets you catch deteriorating aftertreatment performance before it triggers an inspection failure or a tampering allegation. Advanced telematics can surface anomalies in fuel economy or missing fault codes that indicate early aftertreatment issues, allowing internal remediation before an external inspection.
Electrification planning becomes data-driven when you have 12 months of duty-cycle records. Vehicles with high idle hours, short average trip distances, and predictable routes are the best early EV candidates. Emissions tracking data tells you exactly which units those are.
- Driver engagement tip: link idle-reduction targets to individual scorecards and recognize top performers publicly. Drivers respond to programs that connect their behavior to visible, personal outcomes.
How to calculate ROI and produce audit-ready reports
The ROI math for a fleet emissions program is straightforward. A fleet spending $500,000 annually on fuel that achieves a 12–18% reduction saves $60,000–$90,000 per year. Add reduced maintenance costs from fewer unplanned DPF replacements and lower idle-related engine wear, and most fleets reach payback within 6–12 months of full deployment.
Audit-ready Scope 1 reporting requires more than accurate numbers. It requires a traceable chain from fuel purchase to emissions figure:
- Every gallon ties to a fuel-card transaction with a date, vehicle assignment, and fuel type.
- Telematics records confirm the vehicle was operating during the period and provide odometer-based mileage.
- Emission factors are documented by source (EPA GHG Emission Factors Hub, version and year) and applied consistently.
- Variance investigations are logged with resolution notes.
Auditors and procurement teams commonly reject reports built on estimates. The reconciliation standard is a transaction-level match between fuel cards, telematics, and vehicle assignments.
Framework alignment matters for customer-facing reports. Scope 1 covers direct emissions from vehicles your fleet owns or controls. Scope 2 covers electricity used for EV charging. Scope 3 is where your customers’ procurement teams sit: when they ask for your emissions data, they are calculating their own Scope 3. Providing clean Scope 1 figures makes you easier to work with and harder to replace.
Fleet GPS data integration with your fuel-card and maintenance platforms is what makes this reporting sustainable at scale rather than a quarterly manual exercise.

Driver consent, privacy, and legal requirements in North America
GPS and telematics tracking of company vehicles is generally permissible in North America, but state-level rules vary on consent, notice, and employer policies. California requires specific notice provisions and has stricter employee privacy protections than most other states. Fleets operating across multiple states should build their policy to meet the most stringent applicable standard.
A well-designed tracking policy covers:
- Purpose statement: What data is collected, why, and how it will be used (emissions reporting, safety, operational efficiency).
- Notice and consent: Written acknowledgment from drivers before devices are deployed on company vehicles.
- Data retention: Retain fuel and telematics records long enough to satisfy audit requirements (typically 3–5 years), then delete per policy.
- Access controls: Limit data access to personnel with a documented operational need.
- BYOD vs. company vehicle distinction: Tracking rules differ significantly for personal vehicles used for work. Restrict emissions tracking to company-owned or company-leased assets unless legal counsel has reviewed the BYOD scenario.
Regulatory compliance obligations at the state level, including CARB and state inspection programs, also require documented maintenance and emissions records. A tracking policy that covers both operational monitoring and compliance recordkeeping reduces your exposure on both fronts.
Pro Tip: The simplest way to secure driver buy-in is to explain the program in terms of what it does for them: fewer false maintenance accusations, documented proof of proper operation, and recognition for fuel-efficient driving. Framing the policy around driver protection, not surveillance, produces faster adoption and fewer grievances.
Research evidence: what the studies actually show
The operational case for fleet emissions monitoring is well-supported by published research.
- Long-haul trucks idle over 2,000 hours per year, consuming 0.46–0.65 gallons of fuel per idle hour. For a 50-truck fleet, that represents a substantial and directly recoverable fuel cost.
- A multi-component intervention study found that combining telematics, driver feedback, and training reduced engine idling by 8.6% and total fuel consumption by 6.6%.
- Fleets running active emissions-reduction programs report fuel cost savings in the 12–18% range within 6–12 months of deployment.
- Route optimization using telematics data reduces emissions by a notable margin compared with manual dispatch planning.
The 6–12 month payback window is consistent across fleet sizes and duty cycles when programs combine idle reduction, route optimization, and driver engagement. Fleets that implement only one component typically see smaller, slower returns.
Key Takeaways
Tracking fleet emissions delivers measurable fuel savings in the 12–18% range, audit-ready Scope 1 data, and procurement eligibility — all within a 6–12 month payback window when programs combine telematics, fuel-card reconciliation, and driver engagement.
| Point | Details |
|---|---|
| Start a 90-day baseline | Collect fuel-card, telematics, and odometer data before calculating any emissions figures. |
| Reconcile fuel cards to telematics | Match transactions to vehicle assignments monthly; flag variances above 3% before quarterly reporting. |
| Run an idle-reduction pilot | Target idle hours first — trucks idle over 2,000 hours/year, burning 0.46–0.65 gallons per hour. |
| Align reports to GHG Protocol Scope 1 | Document emission factor sources and versions so reports pass procurement and third-party verification. |
| Motowatchdog supports the program | Motowatchdog’s subscription-free GPS devices provide trip and mileage reporting, idle-time tracking, and data export for fuel-card reconciliation with no ongoing monthly fees. |
The operational asset most fleets are still treating as a chore
Most fleet managers I speak with approach emissions tracking as a reporting obligation: something finance asks for at year-end, or a box to check when a customer sends an RFP. That framing is costing them money every month.
The data that produces a defensible Scope 1 report is the same data that identifies your worst idling offenders, your least efficient routes, and your vehicles with deteriorating aftertreatment systems. The reporting is a byproduct. The operational intelligence is the actual value.
Where programs typically fail is not in the technology. It is in data reconciliation discipline. Fleets that skip the monthly fuel-card-to-telematics match end up with variance gaps that invalidate their annual figures. Then they either submit estimates (which auditors reject) or spend weeks reconstructing records they should have maintained continuously. The fix is a 30-minute monthly reconciliation workflow, not a new platform.
Driver buy-in is the second common failure point. Telematics data without driver engagement produces reports but not behavior change. The fleets that hit the 12–18% fuel savings range are the ones that close the loop: share the data with drivers, recognize improvement, and connect individual behavior to fleet-level outcomes. Finance and procurement stakeholders need to see that connection too. When they understand that emissions tracking directly protects contract eligibility, budget conversations about telematics investment get much shorter.
Emissions tracking is not a sustainability initiative competing with operational priorities. It is an operational tool that happens to produce sustainability outputs. Treat it that way, and the ROI case makes itself.
Motowatchdog makes the pilot phase easier and cheaper
Running a baseline or pilot without the burden of monthly subscription fees changes the math on telematics investment. Motowatchdog’s subscription-free GPS tracking devices give fleet managers trip and mileage reporting, idle-time monitoring, maintenance reminders, and data export capabilities from a one-time hardware purchase. No recurring fees means the pilot phase costs what the devices cost, and nothing more.
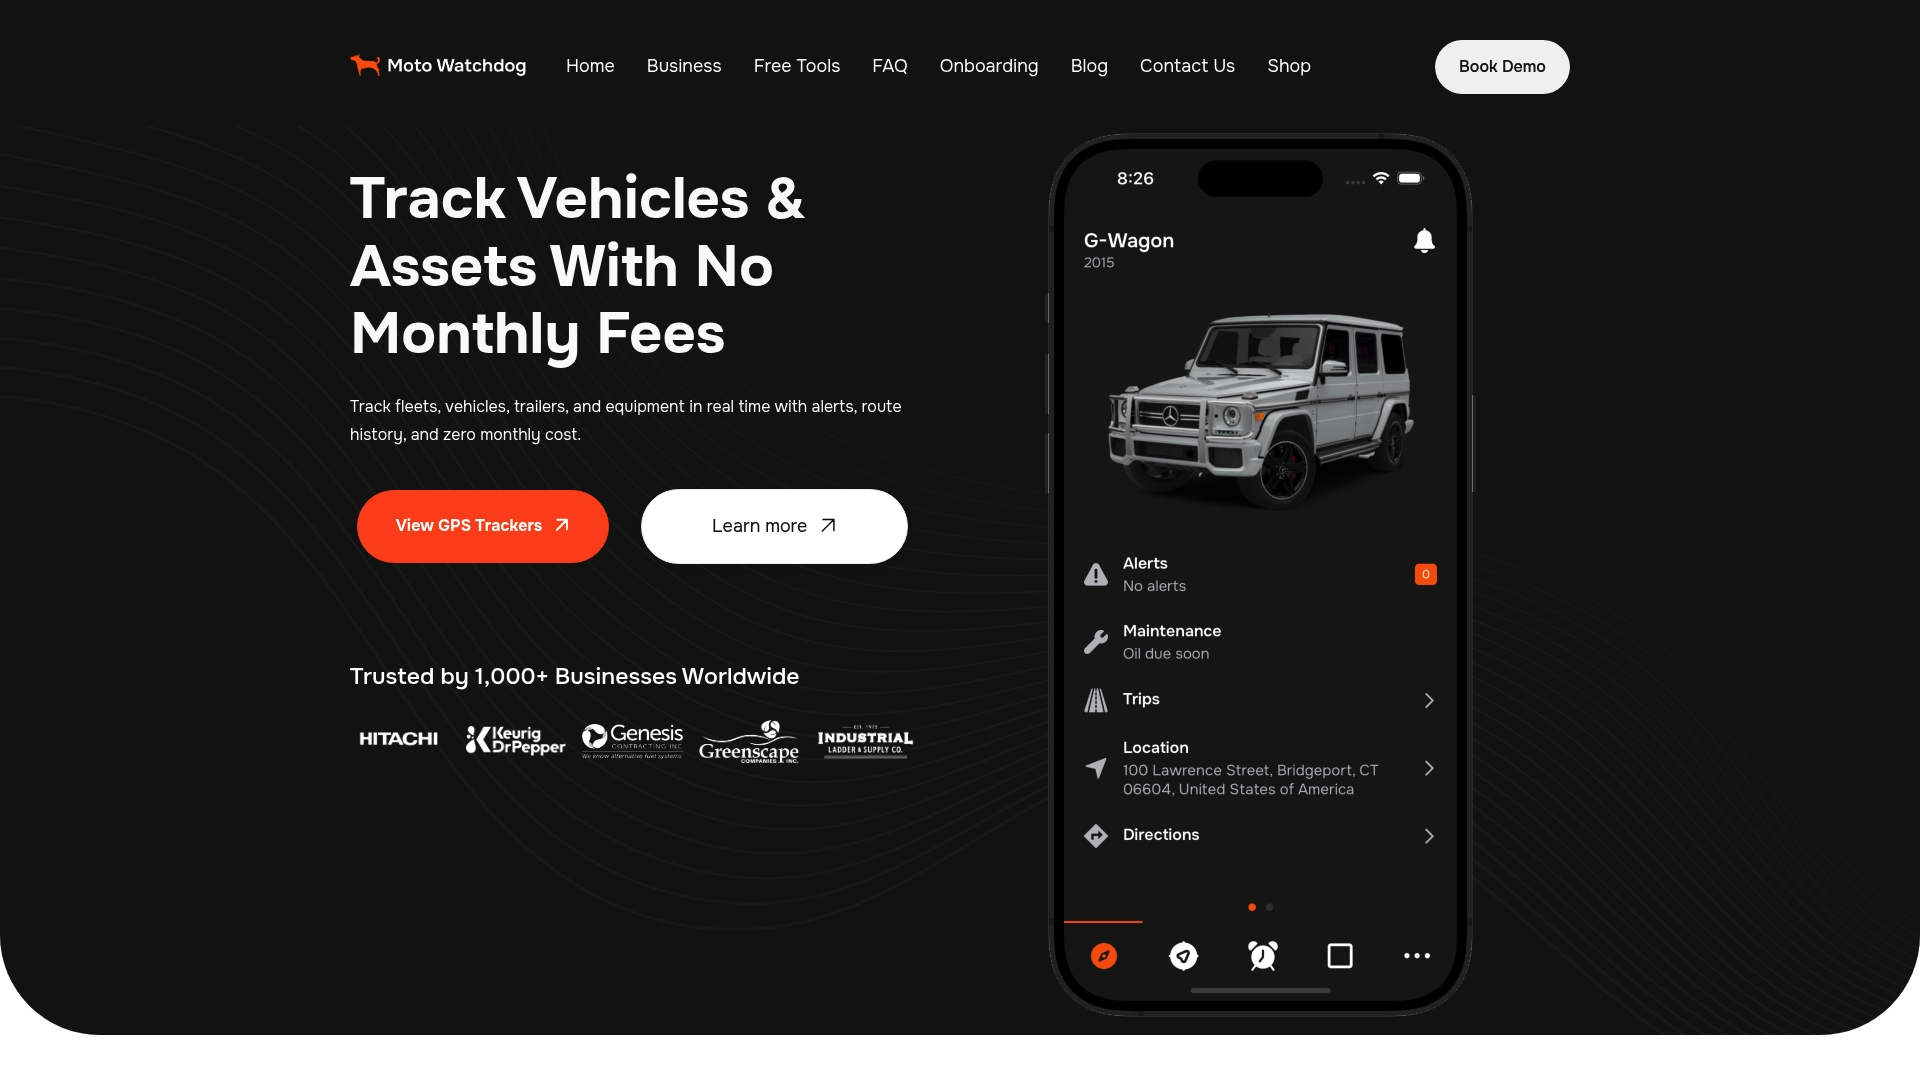
For emissions tracking specifically, Motowatchdog’s idle-time data feeds directly into the idle-hours KPI that drives your Scope 1 calculations and your idle-reduction program. Trip and mileage reports provide the odometer-based VMT figures needed for CO2-per-mile calculations. Maintenance reminders help keep aftertreatment systems in documented compliance. And because the companion app manages multiple devices, scaling from a 10-vehicle pilot to a full fleet deployment does not require a new contract or a pricing conversation.
Over 1,000 businesses rely on Motowatchdog for vehicle and asset monitoring. If you are ready to build a data foundation for your emissions program without adding a subscription line to your operating costs, explore Motowatchdog’s GPS tracking devices and see which configuration fits your fleet.
Useful sources and further reading
Fleet managers who need to verify figures, satisfy auditors, or respond to procurement queries can consult these primary sources directly.
- GHG Protocol Corporate Standard: The foundational framework for Scope 1, 2, and 3 calculations. Available at ghgprotocol.org.
- EPA GHG Emission Factors Hub: Annual updates to emission factors by fuel type, used to convert gallons consumed into CO2 equivalent. Available at epa.gov.
- CARB Fleet Rules and Low-NOx Standards: California Air Resources Board guidance on heavy-duty vehicle requirements and the 2027 Low-NOx rule. Available at arb.ca.gov.
- GREET Model (Argonne National Laboratory): Lifecycle emission factors for conventional and alternative fuels. Available at greet.anl.gov.
- Idling fuel consumption research: Published study on idle hours and fuel burn rates for heavy-duty trucks.
- ESG reporting for trucking fleets: Industry analysis covering fuel savings ranges and multi-component program outcomes.
- Fleet environmental compliance guide 2026: Overview of active state programs, CARB standards, and enforcement trends.
- GPS tracking laws by state: State-level consent and notice requirements for vehicle tracking programs.
Use these sources when preparing methodology documentation for third-party verification or responding to customer procurement questionnaires. Citing primary regulatory and research sources in your emissions reports strengthens their credibility and reduces the likelihood of a verification challenge.