How to start saving money
Lorem ipsum dolor sit amet, consectetur adipiscing elit lobortis arcu enim urna adipiscing praesent velit viverra sit semper lorem eu cursus vel hendrerit elementum morbi curabitur etiam nibh justo, lorem aliquet donec sed sit mi dignissim at ante massa mattis.
- Neque sodales ut etiam sit amet nisl purus non tellus orci ac auctor
- Adipiscing elit ut aliquam purus sit amet viverra suspendisse potent
- Mauris commodo quis imperdiet massa tincidunt nunc pulvinar
- Excepteur sint occaecat cupidatat non proident sunt in culpa qui officia
Why it is important to start saving
Vitae congue eu consequat ac felis placerat vestibulum lectus mauris ultrices cursus sit amet dictum sit amet justo donec enim diam porttitor lacus luctus accumsan tortor posuere praesent tristique magna sit amet purus gravida quis blandit turpis.

How much money should I save?
At risus viverra adipiscing at in tellus integer feugiat nisl pretium fusce id velit ut tortor sagittis orci a scelerisque purus semper eget at lectus urna duis convallis. porta nibh venenatis cras sed felis eget neque laoreet suspendisse interdum consectetur libero id faucibus nisl donec pretium vulputate sapien nec sagittis aliquam nunc lobortis mattis aliquam faucibus purus in.
- Neque sodales ut etiam sit amet nisl purus non tellus orci ac auctor
- Adipiscing elit ut aliquam purus sit amet viverra suspendisse potenti
- Mauris commodo quis imperdiet massa tincidunt nunc pulvinar
- Adipiscing elit ut aliquam purus sit amet viverra suspendisse potenti
What percentege of my income should go to savings?
Nisi quis eleifend quam adipiscing vitae aliquet bibendum enim facilisis gravida neque. Velit euismod in pellentesque massa placerat volutpat lacus laoreet non curabitur gravida odio aenean sed adipiscing diam donec adipiscing tristique risus. amet est placerat in egestas erat imperdiet sed euismod nisi.
“Nisi quis eleifend quam adipiscing vitae aliquet bibendum enim facilisis gravida neque velit euismod in pellentesque”
Do you have any comments? Share them with us on social media
Eget lorem dolor sed viverra ipsum nunc aliquet bibendum felis donec et odio pellentesque diam volutpat commodo sed egestas aliquam sem fringilla ut morbi tincidunt augue interdum velit euismod eu tincidunt tortor aliquam nulla facilisi aenean sed adipiscing diam donec adipiscing ut lectus arcu bibendum at varius vel pharetra nibh venenatis cras sed felis eget.
Harsh braking detection is the automated identification of deceleration events that exceed a defined g-force threshold, commonly used in safety monitoring systems, using vehicle sensors or smartphone accelerometers to flag moments when a driver slows far more abruptly than normal traffic flow requires. For fleet managers, NHTSA research confirms that surrogate metrics like hard-braking events reliably identify risk patterns at scale, making them one of the most practical early-warning signals available before a collision ever occurs.
Three things you should know right away:
- Hard braking is a validated crash surrogate: high-frequency deceleration events correlate with elevated collision risk, giving safety teams a measurable signal to act on before an incident occurs.
- The cost impact is direct: aggressive braking and acceleration increase fuel consumption and accelerate brake and tire wear, raising operating costs across every vehicle in your fleet.
- Detection methods vary widely: embedded accelerometers, OBD-port signals, wheel-speed sensors, and smartphone IMUs each offer different accuracy levels, installation costs, and false-positive rates.
Key Takeaways
Harsh braking detection is most valuable when it drives a structured coaching and routing program, not just an event count.
| Point | Details |
|---|---|
| Definition and threshold | Hard braking exceeds 0.3g–0.5g deceleration; the right threshold depends on your program goal. |
| Validated safety surrogate | A Transformer phone model achieved 0.83 PR-AUC, and NHTSA supports surrogate metrics for risk identification. |
| Normalize before comparing | Use events per 1,000 miles or per 100 trips; raw counts mislead across mixed vehicle classes and route types. |
| False positives are common | Loose mounts, potholes, and GPS noise generate false events; validate with trip replay before coaching. |
| Motowatchdog entry point | Subscription-free GPS trackers provide basic harsh-braking awareness and event alerts with no monthly fees. |
Table of Contents
- What is harsh braking detection, and how does it differ from normal stops?
- How do harsh braking detection systems work?
- What thresholds define a harsh braking event?
- Why should fleet managers monitor harsh braking?
- How does fleet technology use harsh braking data?
- What steps actually reduce harsh braking events?
- How should you measure and report harsh braking across a mixed fleet?
- When does harsh braking not indicate unsafe driving?
- What does the research say about harsh braking as a safety surrogate?
- The metric that most fleets underuse
- Subscription-free GPS tracking for basic harsh-braking awareness
- Sources
What is harsh braking detection, and how does it differ from normal stops?
Harsh braking, sometimes called hard braking or a high-G deceleration event, occurs when a vehicle decelerates strongly beyond typical levels, as measured by accelerometers in terms of gravitational force equivalents. A normal, anticipatory stop from highway speed might produce low deceleration, while a hard stop involves notably higher deceleration, and genuine emergency stops involve even more intense deceleration depending on conditions.
The distinction that matters most for fleet managers is between three categories of braking behavior:
- Normal/predictive braking: The driver reads traffic ahead and decelerates gradually. Deceleration stays below 0.2g. No event is flagged.
- Hard braking: A sudden, forceful stop that exceeds the program threshold (commonly 0.3g–0.5g). May indicate following too closely, distraction, or a road hazard.
- ABS-assisted emergency braking: Maximum-effort stops where the anti-lock braking system cycles to prevent wheel lockup. These can exceed 0.7g and are legitimate safety responses, not necessarily driver error.
Common triggers for hard-braking events include following distance that is too short, driver distraction, unexpected road hazards, and evasive maneuvers to avoid collisions. Each trigger carries a different coaching implication, which is why reviewing the context of an event matters as much as counting it.
Pro Tip: A single isolated hard-braking event on an otherwise clean trip record often reflects a road hazard or legitimate evasive action. Clusters of events on the same driver, same route, or same time of day are the signal worth investigating.
How do harsh braking detection systems work?
Detection systems convert raw sensor data into a binary decision: did this deceleration cross the threshold? The path from raw signal to logged event involves sensor selection, signal conditioning, and an algorithm that classifies the event.
Sensor sources
Embedded vehicle accelerometers are the most accurate option. Mounted rigidly to the chassis, they measure longitudinal deceleration directly in the vehicle’s own reference frame. Dedicated telematics hardware from platforms like Geotab uses this approach, producing enterprise-grade data with minimal orientation error.
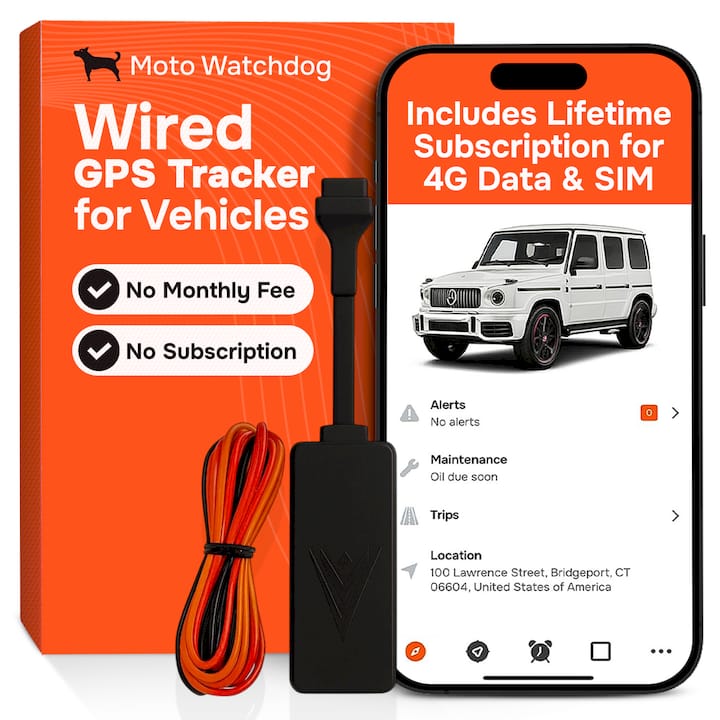
Wheel-speed sensors (accessed via the CAN bus or OBD-II port) infer deceleration from the rate of change in wheel speed. An OBD GPS tracker can read this signal without additional hardware, though the derived deceleration figure is slightly less direct than a dedicated accelerometer.
Smartphone IMUs use the phone’s built-in accelerometer and gyroscope. A Transformer-based detection model tested at scale achieved a 0.83 PR-AUC versus 0.22 for a simple GPS speed heuristic, demonstrating that phone-based detection, when paired with the right algorithm, can rival dedicated hardware in accuracy. The same study confirmed that detected events strongly correlate with collision rates at the road-segment level.
GPS-derived heuristics calculate deceleration from speed change over time. They are the simplest to deploy but the least accurate, with the lowest PR-AUC scores in comparative studies.
Algorithm approaches
Most commercial systems use one of three approaches:
- Threshold-based classification: If the filtered deceleration signal exceeds X g for Y milliseconds, log an event. Simple, transparent, and easy to tune.
- Signal-processing filters: A moving-average filter applied to combined accelerometer and gyroscope magnitudes can separate genuine emergency braking pulses from road vibration and engine noise in real time, without requiring heavy machine learning models.
- ML and transformer models: Deep learning approaches, including transformer architectures, learn complex event signatures from large labeled datasets. They handle edge cases better but require more compute and training data.
Pro Tip: Secure, chassis-aligned mounting is the single highest-leverage step for reducing false positives. A device with a known, fixed orientation eliminates the coordinate-transform errors that plague loosely mounted phones or plug-in OBD dongles that rotate in the port.
| Detection method | Accuracy | False positive risk | Installation cost | Best fit |
|---|---|---|---|---|
| Embedded accelerometer (hardwired) | High | Low | Moderate to high | Enterprise fleets, compliance programs |
| OBD-II / wheel-speed derived | Moderate to high | Low to moderate | Low | Mixed fleets, quick deployment |
| Smartphone IMU + ML model | High (with good model) | Moderate | Very low | Gig/field-service fleets, pilot programs |
| GPS speed heuristic | Low | High | Very low | Rough awareness only |
What thresholds define a harsh braking event?
No single threshold applies to every fleet. Research on high-G events and threshold optimization confirms that the optimal cutoff varies by study objective and fleet context, and that Thresholds around 0.5g have been tested as predictors of crash risk. Practical implementations use thresholds in a range near this value, each with different sensitivity and coaching implications.
| Threshold | Sensitivity | False positive risk | Typical use case |
|---|---|---|---|
| 0.3g | High | Higher | Comprehensive driver coaching programs |
| 0.4g | Moderate | Moderate | Balanced safety scoring and coaching |
| 0.5g | Lower | Lower | Crash-risk prediction, regulatory-adjacent programs |
A lower threshold captures more events, giving coaches more data to work with but also generating more noise. A higher threshold filters out marginal stops and focuses attention on genuinely dangerous deceleration, but it may miss a pattern of moderately aggressive driving that is still eroding brakes and fuel economy.
The practical recommendation: start a 30-day pilot at 0.4g across a representative sample of your fleet before committing to a standard. Compare event rates by vehicle class, route type, and driver tenure. That baseline will tell you whether 0.3g floods your coaching queue or whether 0.5g misses real risk in your specific operating environment.
Why should fleet managers monitor harsh braking?
Hard braking events occur far more frequently than crashes, which makes them statistically useful as a safety surrogate when collision data alone is too sparse to analyze. The correlation between high-G events and collision rates at the road-segment level has been validated in large-scale studies, giving fleet safety programs a leading indicator rather than a lagging one.
The operational cost picture is equally direct. Aggressive driving habits, including harsh braking, increase fuel consumption and accelerate vehicle wear, producing measurable cost impacts across brake pads, rotors, tires, and fuel spend. For a fleet running dozens of vehicles, the cumulative effect on maintenance schedules and unplanned downtime is significant.
Key cost and safety impacts to track:
- Brake and rotor wear: Hard stops generate heat and friction that shorten pad and rotor life, increasing replacement frequency.
- Tire wear: Aggressive deceleration transfers load to front tires, accelerating uneven wear patterns.
- Fuel penalty: Kinetic energy lost in a hard stop must be rebuilt through acceleration, burning additional fuel on every cycle.
- Unscheduled downtime: Accelerated component wear leads to more frequent shop visits outside planned maintenance windows.
- Insurance exposure: Carriers increasingly use telematics data in commercial fleet underwriting; a high hard-braking rate can affect premiums.
- Customer perception: For last-mile delivery and passenger transport fleets, harsh braking is directly felt by cargo and passengers, affecting service quality scores.
| Impact category | Mechanism | Monitoring benefit |
|---|---|---|
| Crash risk | High-G events correlate with collision rates | Early intervention before a crash occurs |
| Brake/tire wear | Heat and load transfer from hard stops | Predictive maintenance scheduling |
| Fuel consumption | Energy lost in abrupt deceleration | Identify high-cost drivers for coaching |
| Insurance premiums | Telematics-based underwriting | Demonstrate safety improvement to carriers |
How does fleet technology use harsh braking data?
Raw event counts become useful only when they feed a structured workflow. The most effective programs follow a consistent loop:
- Real-time alert: The telematics system sends a harsh braking alert to a supervisor or safety manager within minutes of the event.
- Event review: The safety team pulls the trip replay, speed profile, and location context to determine whether the event reflects driver behavior or an external factor.
- Coaching session: If the event reflects driver behavior, the manager delivers a short, evidence-based coaching conversation within 24–48 hours while the trip is still fresh.
- Verification: The driver’s event rate is tracked over the following 30 days to confirm improvement or flag the need for retraining.
Hard-braking events aggregated at the road-segment level provide a statistically useful signal for hotspot mapping, route safety scoring, and proactive infrastructure or routing interventions, even when individual crash data is too sparse to analyze directly.
Enterprise telematics platforms like Geotab and Verizon Connect integrate harsh-braking data into driver scorecards, safety dashboards, and maintenance triggers. Geotab’s platform, for example, logs events with GPS coordinates, speed, and time, enabling both individual coaching and fleet-wide hotspot analysis. Verizon Connect surfaces driver safety scores that weight harsh braking alongside speeding and rapid acceleration, giving managers a single composite metric for performance reviews.
For fleets that want GPS data integrated into reporting and maintenance systems, the key integrations to prioritize are: telematics dashboard to safety KPI report, event data to maintenance system for brake inspection triggers, and driver scorecard to HR or coaching records.
Pro Tip: Set your harsh braking alert threshold slightly higher than your coaching threshold. Alerts at 0.5g keep supervisors focused on genuinely dangerous events; coaching reviews can still pull in 0.3g events from weekly reports without flooding real-time inboxes.
Smartphone-based detection apps offer a low-barrier entry point for smaller fleets or pilot programs. Entry-level subscription-free trackers provide basic event logging and location context without the per-vehicle monthly fees of enterprise platforms, making them practical for contractors and small fleet operators who need awareness without a full telematics suite.
What steps actually reduce harsh braking events?
Reducing event rates requires a structured program, not a one-time memo. Here is a practical sequence:
- Establish a baseline. Run harsh braking monitoring for 30 days before making any changes. Record events per 1,000 miles by driver and vehicle class.
- Set and communicate thresholds. Tell drivers exactly what triggers an event and why the threshold was chosen. Transparency reduces resistance.
- Pilot the threshold. Adjust sensitivity based on your baseline data before rolling out fleet-wide.
- Deliver individual coaching. Use trip replay evidence. Keep sessions factual: “On Tuesday at 2:14 PM on Route 9, the system recorded a 0.47g stop. Here is the speed profile. What was happening at that point?”
- Check vehicle condition. Worn brake components, misaligned wheels, and low tire pressure can cause drivers to apply more force to achieve normal stopping distances. Mechanical issues produce real events that coaching alone cannot fix.
- Adjust routes where warranted. If hotspot mapping shows repeated events at specific intersections or highway exits, evaluate whether a route change reduces exposure.
- Measure impact at 60 and 90 days. Compare event rates against the baseline. Recognize drivers who improve.
Coaching language matters. Short, factual, non-accusatory feedback paired with trip evidence produces better results than general safety lectures. Positive reinforcement for drivers who reduce their event rates over a 30-day window reinforces the behavior you want.
Pro Tip: Avoid alarm fatigue by focusing coaching resources on repeat offenders first. A driver with five events in a week needs attention before a driver with one event in a month. Sorting your weekly report by event frequency, not alphabetically, keeps priorities clear.
Vehicle maintenance checks that directly reduce true harsh-braking events:
- Brake pad and rotor inspection at each service interval
- Tire pressure and tread depth checks weekly for high-mileage vehicles
- ABS system diagnostic scan if a driver reports unexpected pedal behavior
- Suspension and alignment check for vehicles operating on rough routes
How should you measure and report harsh braking across a mixed fleet?
Raw event counts are misleading without normalization. A driver covering 500 miles per week will naturally accumulate more events than one covering 150 miles, even at the same behavioral level. The standard normalization approach is events per 1,000 miles or events per 100 trips, which puts every driver on a comparable scale regardless of route length.
For mixed fleets, vehicle class matters too. A heavy-duty truck stopping at a loading dock operates differently from a light-duty van on urban delivery routes. Separate your KPIs by vehicle class and route type before comparing drivers across categories.
Recommended KPIs for a fleet safety dashboard:
- Events per 1,000 miles (primary normalization metric)
- Events per 100 trips (useful for short-haul urban fleets)
- Percentage of drivers with zero events in the past 30 days
- Percentage of drivers with three or more events in the past 30 days (repeat-offender rate)
- Month-over-month change in fleet-wide event rate
| KPI | Formula | Reporting cadence | Audience |
|---|---|---|---|
| Events per 1,000 miles | Total events / total miles × 1,000 | Weekly | Safety team, operations |
| Events per 100 trips | Total events / total trips × 100 | Weekly | Safety team |
| Repeat-offender rate | Drivers with 3+ events / total drivers × 100 | Monthly | Safety manager, HR |
| Fleet-wide trend | Month-over-month % change in event rate | Monthly | Leadership, insurance |
Note that FMCSA regulations govern hours of service and driver records but do not define harsh-braking thresholds. Your event-rate KPIs are operational safety tools, not regulatory compliance metrics. Keep that distinction clear when presenting data to drivers or in legal contexts.
When does harsh braking not indicate unsafe driving?
Not every flagged event reflects poor driver behavior. Understanding common false positives protects drivers from unfair discipline and keeps your safety program credible.
Common false-positive causes:
- Loose phone or device mount: A phone that shifts position mid-trip introduces orientation errors that can register as deceleration events even on smooth roads.
- Speed bumps and potholes: Vertical acceleration from road surface impacts can register on a longitudinal axis if the device is not perfectly aligned.
- Dropped objects: A phone or tablet falling from a mount generates a sharp acceleration spike that mimics a braking event.
- Engine vibration at idle: High-frequency vibration from diesel engines at idle can saturate a poorly filtered accelerometer.
- GPS signal noise: In urban canyons, GPS-derived speed estimates can jump erratically, producing false deceleration calculations.
ABS activation changes the sensor signature of a stop. The system cycles brake pressure rapidly, which can produce oscillating acceleration readings that a threshold-based detector may count as multiple events from a single stop. Signal-processing filters that preserve the braking pulse shape while smoothing high-frequency noise reduce this problem substantially.
Before disciplining a driver for a flagged event, run a three-step validation:
- Pull the trip replay and check the speed profile at the event timestamp.
- Review any available dashcam footage for the same moment.
- Ask the driver for their account of the trip segment.
Pro Tip: Configure a minimum-speed filter so events below 10–15 mph are excluded from coaching reports. Most low-speed false positives (parking lot maneuvers, dock approaches) occur in this range and add noise without safety value.
What does the research say about harsh braking as a safety surrogate?
The academic and industry evidence supporting harsh-braking monitoring as a crash surrogate is well-established. High-G events occur at a frequency that makes them statistically tractable for safety analysis, unlike crashes, which are too rare in most fleets to support regression modeling on their own.
Key findings from the research base:
- A Transformer-based smartphone detection model achieved a 0.83 PR-AUC, compared to 0.22 for a GPS speed heuristic, and detected events correlated strongly with collision rates at the road-segment level, validating phone-based detection as a legitimate safety surrogate.
- A moving-average preprocessing method combining accelerometer and gyroscope magnitudes demonstrated high detection accuracy for emergency braking in real-time, lightweight implementations, making it practical for embedded systems without heavy ML infrastructure.
- Research on threshold optimization found that 0.5g has been tested as a crash-risk predictor, but no single threshold is universally optimal; the right cutoff depends on whether the program goal is hotspot mapping, individual coaching, or insurance scoring.
- NHTSA guidance supports using surrogate safety metrics to identify risk patterns when crashes are too infrequent to analyze directly, providing a government-level endorsement for the approach.
Methodological notes worth keeping in mind: phone-based detection at scale requires fairness and bias evaluation to confirm that model performance is consistent across driver subgroups and geographic areas. Sensor orientation and coordinate transforms remain practical implementation challenges, particularly for smartphone-based systems where device position varies between drivers.
| Method | Validation approach | Key finding |
|---|---|---|
| Transformer phone model | PR-AUC vs. GPS heuristic | 0.83 vs. 0.22 PR-AUC; strong collision correlation |
| Moving-average filter | Real-time embedded detection | High accuracy separating braking from road noise |
| Threshold optimization (0.5g) | Crash-risk regression | Optimal threshold varies by program objective |
The metric that most fleets underuse
Most fleet safety programs treat harsh braking as a disciplinary trigger. That framing misses the deeper value of the data.
The most useful insight from a well-run harsh-braking program is not which driver had the most events last week. It is where events cluster on your route network and what time of day they concentrate. A hotspot at a specific intersection that generates events across multiple drivers is a routing or scheduling problem, not a driver problem. Addressing it through a route adjustment or a shift-time change eliminates the risk for every driver who passes that point, without a single coaching conversation.
The second underused application is maintenance prediction. A driver whose event rate climbs steadily over four weeks without a change in route or behavior often has a vehicle with degrading brake performance. The telematics data is telling you the brakes need inspection before the driver tells you the pedal feels soft.
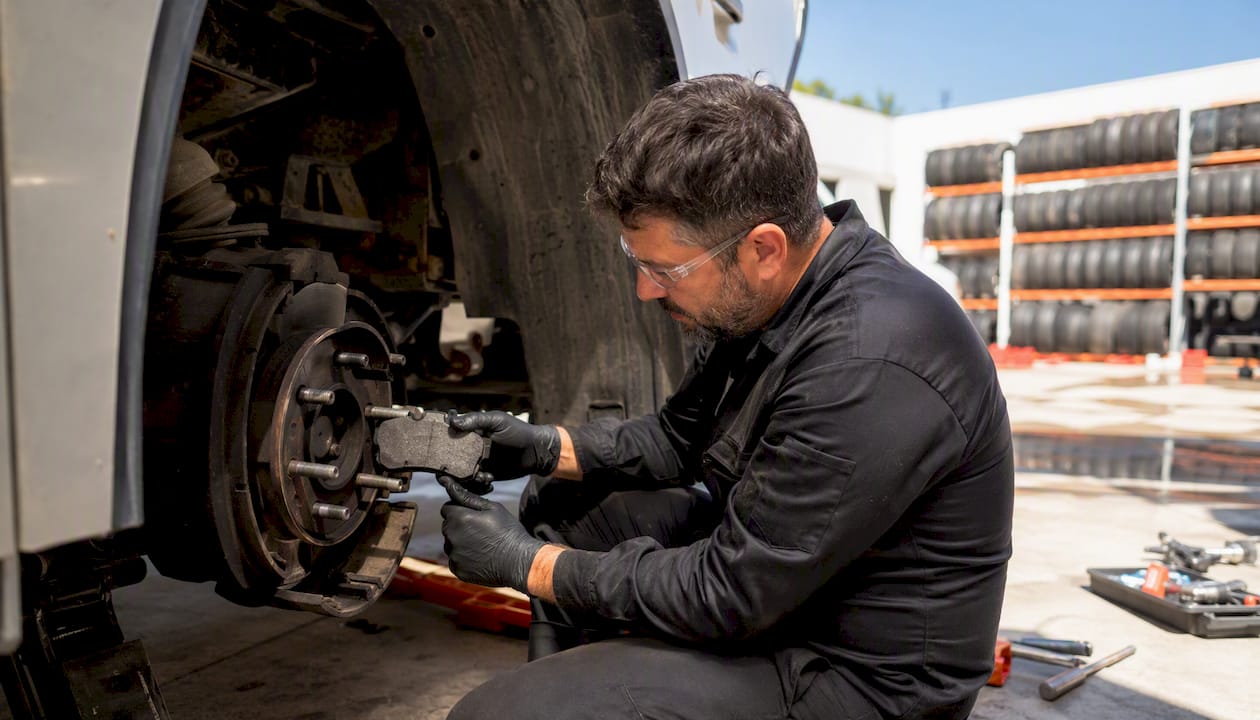
Treating harsh-braking data as a systems diagnostic, not just a behavioral scorecard, is what separates programs that reduce crash rates from programs that just generate reports.
Subscription-free GPS tracking for basic harsh-braking awareness
For fleet managers who want to start monitoring harsh braking without committing to a per-vehicle monthly subscription, Motowatchdog offers a practical entry point. The subscription-free GPS trackers provide real-time location tracking, customizable geofencing alerts, and event notifications with a one-time hardware purchase and no recurring fees. Over 1,000 businesses rely on Motowatchdog for vehicle and asset monitoring across North America.
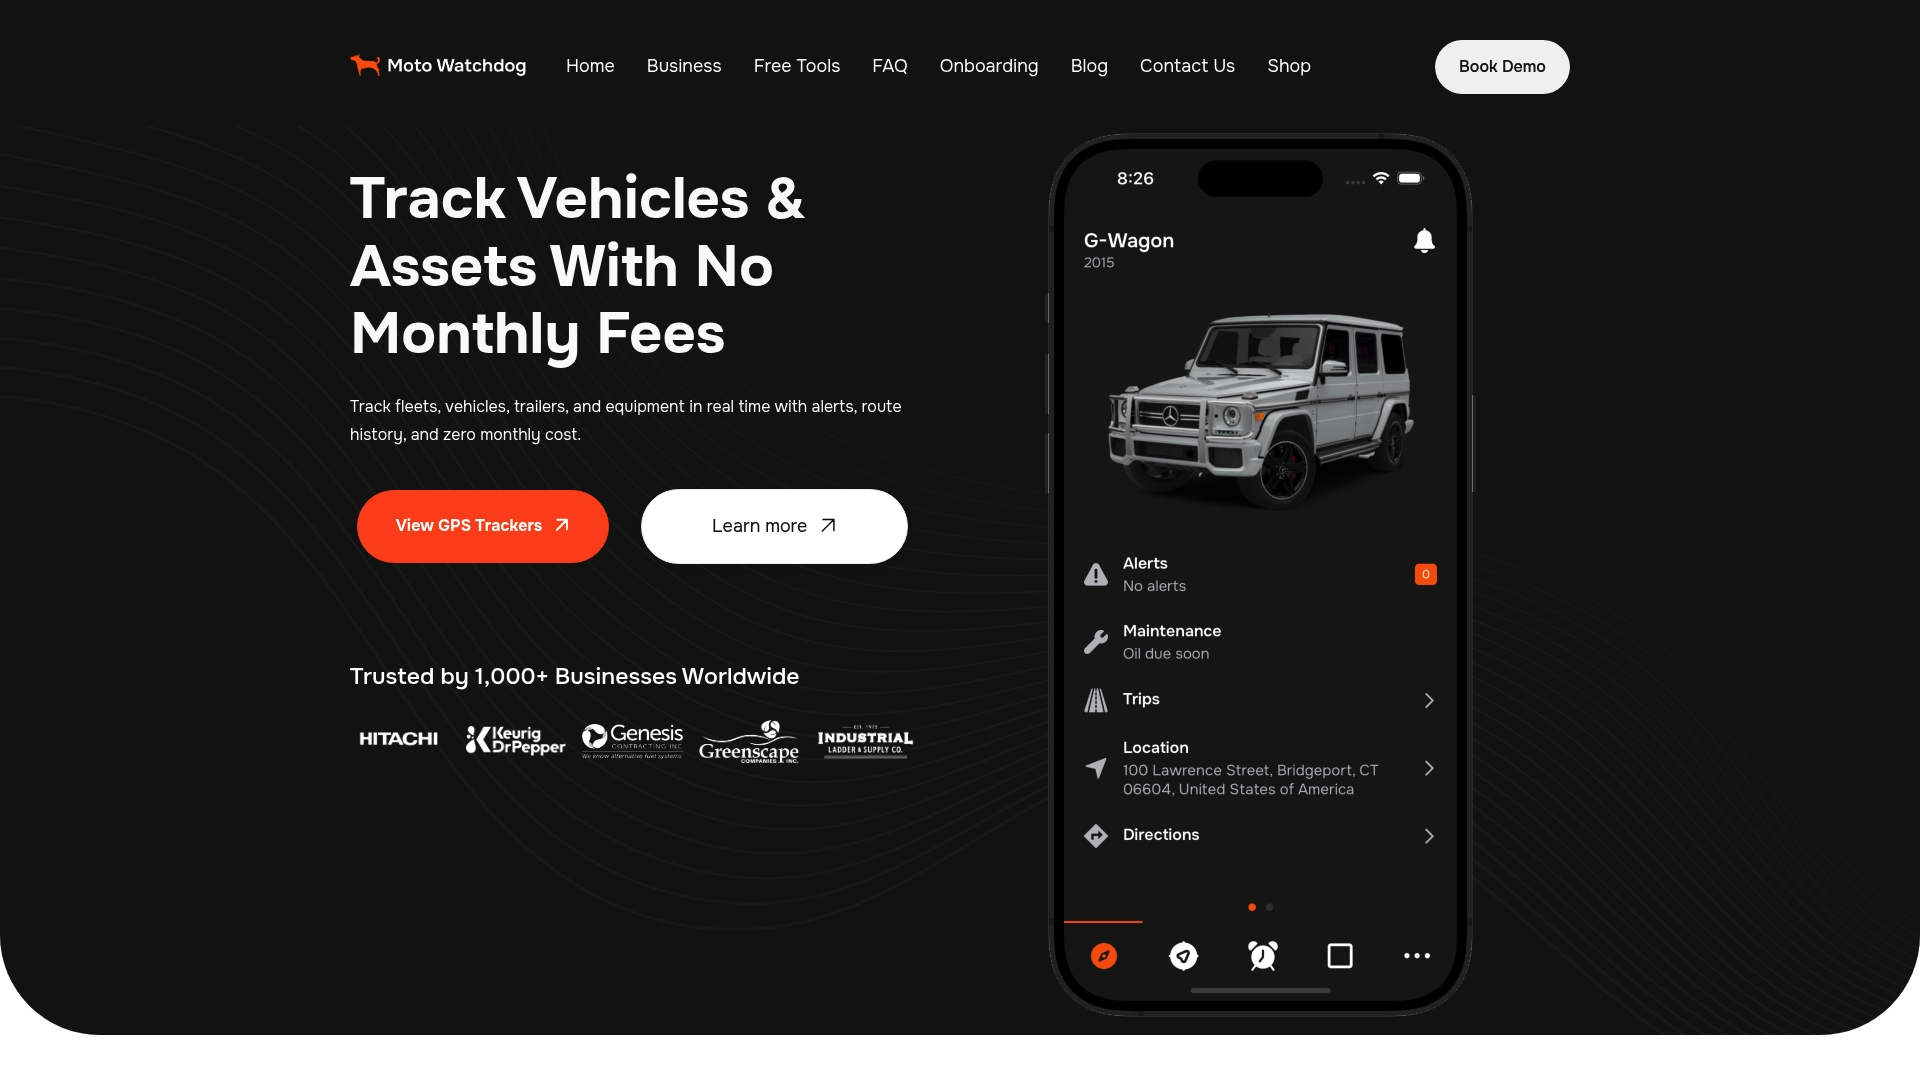
The honest scope: Motowatchdog devices are well-suited for fleets that need basic harsh-braking awareness, location history, and trip reporting without the overhead of an enterprise telematics contract. They do not include the driver-scorecard dashboards, deep CAN-bus integration, or ML-based event classification that platforms like Geotab or Verizon Connect offer. For small fleets, contractors, and managers running a pilot program before investing in full telematics, that tradeoff is often the right one. Hardwiring the device to the vehicle, as covered in the fleet hardwiring guide, improves detection accuracy by eliminating orientation errors from loose mounts. Visit Motowatchdog to review device options and find the right fit for your fleet size and budget.
Sources
- Nhtsa
- Real-Time Vehicle Emergency Braking Detection with Moving Average Method Based on Accelerometer and Gyroscope
- Fueleconomy
- ScienceDirect study on high G‑force events and threshold optimization
- Fmcsa