How to start saving money
Lorem ipsum dolor sit amet, consectetur adipiscing elit lobortis arcu enim urna adipiscing praesent velit viverra sit semper lorem eu cursus vel hendrerit elementum morbi curabitur etiam nibh justo, lorem aliquet donec sed sit mi dignissim at ante massa mattis.
- Neque sodales ut etiam sit amet nisl purus non tellus orci ac auctor
- Adipiscing elit ut aliquam purus sit amet viverra suspendisse potent
- Mauris commodo quis imperdiet massa tincidunt nunc pulvinar
- Excepteur sint occaecat cupidatat non proident sunt in culpa qui officia
Why it is important to start saving
Vitae congue eu consequat ac felis placerat vestibulum lectus mauris ultrices cursus sit amet dictum sit amet justo donec enim diam porttitor lacus luctus accumsan tortor posuere praesent tristique magna sit amet purus gravida quis blandit turpis.

How much money should I save?
At risus viverra adipiscing at in tellus integer feugiat nisl pretium fusce id velit ut tortor sagittis orci a scelerisque purus semper eget at lectus urna duis convallis. porta nibh venenatis cras sed felis eget neque laoreet suspendisse interdum consectetur libero id faucibus nisl donec pretium vulputate sapien nec sagittis aliquam nunc lobortis mattis aliquam faucibus purus in.
- Neque sodales ut etiam sit amet nisl purus non tellus orci ac auctor
- Adipiscing elit ut aliquam purus sit amet viverra suspendisse potenti
- Mauris commodo quis imperdiet massa tincidunt nunc pulvinar
- Adipiscing elit ut aliquam purus sit amet viverra suspendisse potenti
What percentege of my income should go to savings?
Nisi quis eleifend quam adipiscing vitae aliquet bibendum enim facilisis gravida neque. Velit euismod in pellentesque massa placerat volutpat lacus laoreet non curabitur gravida odio aenean sed adipiscing diam donec adipiscing tristique risus. amet est placerat in egestas erat imperdiet sed euismod nisi.
“Nisi quis eleifend quam adipiscing vitae aliquet bibendum enim facilisis gravida neque velit euismod in pellentesque”
Do you have any comments? Share them with us on social media
Eget lorem dolor sed viverra ipsum nunc aliquet bibendum felis donec et odio pellentesque diam volutpat commodo sed egestas aliquam sem fringilla ut morbi tincidunt augue interdum velit euismod eu tincidunt tortor aliquam nulla facilisi aenean sed adipiscing diam donec adipiscing ut lectus arcu bibendum at varius vel pharetra nibh venenatis cras sed felis eget.
To track equipment lifespan and wear effectively, start with three actions this week: (1) tag every tracked machine with its current engine hours, (2) conduct a baseline undercarriage inspection and photograph reference points, and (3) set PM triggers at your next 250-hour interval. That combination of recorded usage, scheduled measurement, and condition-based alerts is what separates fleets that predict failures from those that react to them.
Here is your starter checklist:
- Tag assets: Record the current engine-hour reading on each tracked machine and enter it into a spreadsheet or CMMS.
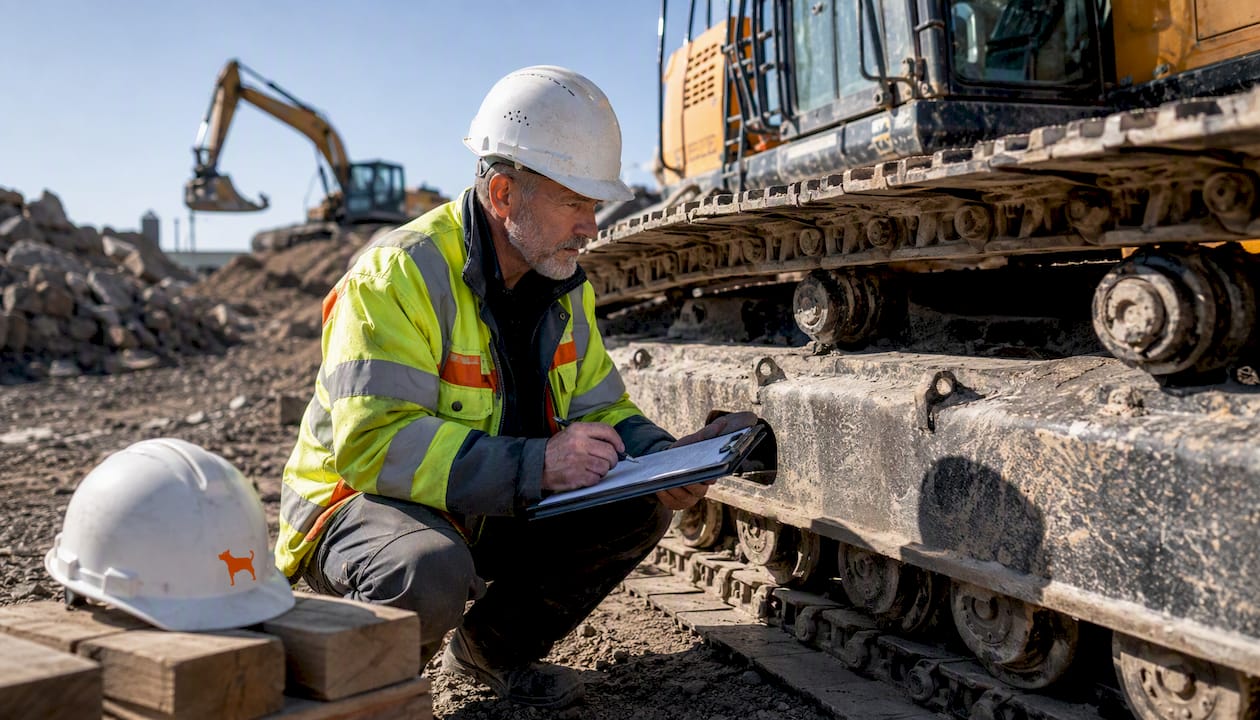
- Baseline inspection: Measure bushing percent-worn, track tension, and lug depth on every machine. Photograph each measurement point from the same angle.
- Set PM triggers: Schedule your first 250-hour visual undercarriage check and your 500-hour measurement interval from today’s hour reading.
- Start logging duty: Enable a GPS or telematics device to capture engine hours, idle time, and geofenced site duty automatically. Motowatchdog is a practical, subscription-free option for this step.
The rest of this guide explains the benchmarks, inspection steps, monitoring tools, and rebuild decisions that turn those first actions into a repeatable program.
Table of Contents
- How long does tracked equipment actually last?
- What factors accelerate track and undercarriage wear the most?
- What does a proper undercarriage inspection look like?
- Which monitoring methods work best for tracked equipment?
- What maintenance actions extend track and undercarriage life the most?
- Should you rebuild the undercarriage or replace the machine?
- Key Takeaways
- Why condition data is only as good as your execution window
- Motowatchdog makes it easy to start logging hours today
- Useful sources and further reading
How long does tracked equipment actually last?
Lifespan benchmarks for tracked machines vary widely, but the table below gives planning-grade ranges based on typical North American fleet experience. Manufacturer data and service records remain the most reliable baseline; combine OEM intervals with site-specific telemetry when operating in abrasive or extreme conditions.
| Equipment Type | Typical Operating-Hour Life | Rebuild/Replace Trigger |
|---|---|---|
| Compact track loader | a wide range of operating hours (rubber tracks) | Rubber track replacement at 50–60% lug wear |
| Excavator (steel undercarriage) | — | Bushing turn at 50% worn; rebuild at 100% |
| Crawler dozer (steel undercarriage) | — | Bushing turn at 50% worn; rebuild at 100% |
| Track loader (steel undercarriage) | — | Sprocket/idler replacement at trigger worn percentage |
Rubber tracks vs. steel undercarriage: Rubber tracks on compact equipment typically last 1,500–2,500 hours under normal conditions, but that range shrinks fast on rocky ground, sharp debris, or steep slopes. Steel undercarriage components on larger machines carry longer life ranges, but the bushing is the critical wear item: once it reaches 100% worn without a scheduled turn, sprocket and rail wear accelerates sharply.
Published averages are starting points, not guarantees. On sites with high sand content in the soil, research shows sand percentage is a leading predictor of bushing and sprocket degradation. Budget conservatively: plan for 70–80% of the optimistic life range on abrasive sites, and treat any figure above that as a bonus.
What factors accelerate track and undercarriage wear the most?
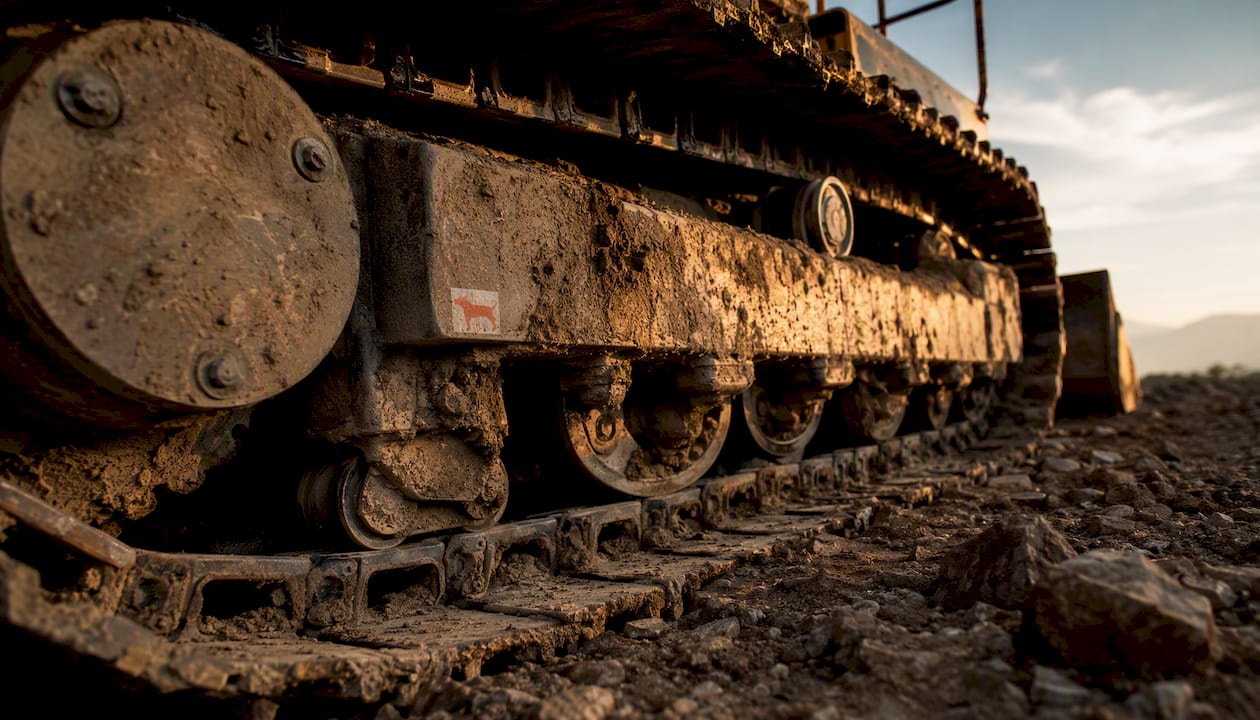
Not all wear drivers are equal, and not all of them are within your control. Separating the two helps you focus resources where they produce the biggest return.
Controllable factors:
Uncontrollable site factors:
- Soil sand content: — Sand percentage in soil significantly increases wear rate, with higher concentrations correlating directly to faster bushing and sprocket degradation. This is the single most important site variable to document at job start.
What does a proper undercarriage inspection look like?
A repeatable inspection workflow produces data you can trend. The goal is consistent measurements from the same reference points, logged every time, so you can see wear rate rather than just wear state.
Daily quick checks (5 minutes per machine)
- Walk the full undercarriage perimeter and look for visible damage: cracked shoes, bent track links, leaking seals on rollers or idlers.
- Check track tension visually: the track should have a slight sag at the bottom, not be drum-tight or dragging.
- Clear packed debris from sprocket teeth and roller frames.
- Note any unusual noise during startup travel (grinding or squealing from rollers is an early warning).
Weekly and monthly measurement procedure
- Lockout/tagout the machine — per OSHA 1926.1427 before any hands-on measurement. No exceptions.
- Measure bushing percent-worn using an ultrasonic gauge or caliper at the designated wear flat. Ultrasonic measurement and percent-worn reporting are the standard method for scheduling bushing turns and rebuilds; the trigger for a bushing turn is typically 50% worn, with a rebuild required at 100%.
Measurement thresholds and trigger points
| Component | Measurement | Action Trigger |
|---|---|---|
| Bushing (steel undercarriage) | Percent-worn | Turn at 50%; rebuild at 100% |
| Track tension | Sag measurement | Outside OEM ± 10mm tolerance: re-tension |
| Rubber track lug depth | Depth gauge reading | Replace at 50–60% lug wear |
| Idler/roller | Vibration or visual wobble | Elevated vibration or visible wobble: replace |
| Sprocket tooth | Tooth height measurement | Replace before full wear threshold |
Pro Tip: Build a one-page baseline form with machine ID, measurement fields, a photo checklist, and the OEM tolerance for each item. Laminate it and attach it to the machine. Technicians who use a consistent form produce data you can actually trend; technicians working from memory produce noise.
Common PM triggers used in the industry are 250-hour visual undercarriage checks and 500-hour full measurement intervals for most tracked machines.
Which monitoring methods work best for tracked equipment?
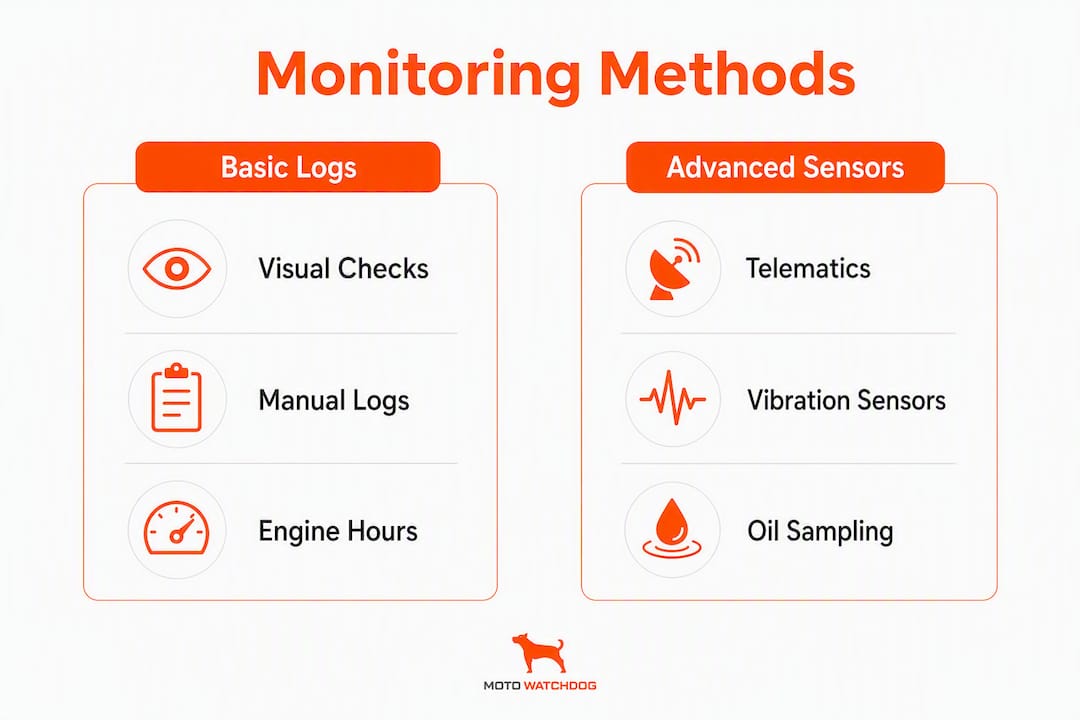
Think of monitoring as a ladder: each rung adds resolution and cost. Start at the bottom and move up only where the failure cost justifies it.
Manual inspection logs
The foundation. A paper or spreadsheet log of every inspection reading, tied to engine hours, costs almost nothing and produces the trend data that every higher-level method depends on. Without a log, you have snapshots; with one, you have a wear rate.

Engine-hour and geofence-based telematics
GPS telematics devices capture engine hours, travel distance, idle time, and geofenced site duty automatically. This matters because calendar-based PM intervals are a poor proxy for actual usage: a dozer working 12-hour shifts in abrasive soil accumulates wear three times faster than one doing light grading. Fleets that link telematics engine-hour data directly to PM triggers report significant reductions in unplanned downtime after integrating a digital CMMS with telematics.
Motowatchdog offers subscription-free GPS tracking with engine-hour logging, geofence alerts, idle-time reports, maintenance reminders, and fleet data export. For fleets that are not yet running any telematics, a multi-week pilot on a handful of high-risk machines is a low-friction way to validate hour capture before scaling. Pair the device with a hardwired installation on heavy equipment to ensure persistent power and reliable hour capture.
Inline tension sensors and vibration monitors
Dedicated tension sensors mounted on the track frame provide continuous tension readings and flag deviations before they cause damage. Vibration monitors on rollers and idlers detect bearing degradation early. Match the technique to the failure mode: vibration analysis works best for bearings and rollers; oil analysis targets lube degradation; ultrasound detects lubrication defects in sealed components. These methods are complementary, not interchangeable.
Pro Tip: Before enabling any condition-monitoring alerts, follow ISO 20816 guidance on sensor selection and mounting: choose the correct transducer for the parameter you are measuring, mount it rigidly to a non-resonant surface, and collect a 14–30 day burn-in baseline before setting alarm thresholds. Alerts triggered before a baseline is established produce false positives that erode technician trust in the system.
Oil and ultrasound sampling
Periodic oil sampling from final drives and hydraulic systems detects metal particle contamination before it becomes visible damage. Ultrasound testing of sealed bearings identifies lubrication defects at early stages. Both methods are cost-effective on high-value machines where a single failure justifies the sampling cost.
What maintenance actions extend track and undercarriage life the most?
Undercarriage components represent a significant share of total tracked-equipment maintenance cost, and documented inspection regimes combined with reverse-travel policies frequently extend component life substantially. The following schedule captures the highest-return actions.
Daily:
- Clear debris from sprocket teeth and roller frames.
- Visual tension check and damage walk-around.
- Log any abnormal noise or visible wear.
Every 250 hours:
- Full visual undercarriage inspection with log entry.
- Track tension measurement and adjustment to OEM spec.
- Lubrication of idler and roller seals per OEM schedule.
Every 500 hours:
- Full measurement cycle: bushing percent-worn, lug depth, sprocket tooth height, idler/roller condition.
- Review wear-rate trend from logs; flag any component approaching its trigger threshold.
- Inspect final drive seals and oil level.
Annually or at major rebuild windows:
- Full undercarriage component assessment against percent-worn thresholds.
- Sprocket replacement decision based on tooth height measurement.
- Review operator behavior data from telematics (idle time, reverse travel percentage, high-speed travel events).
Operating policy changes that reduce wear:
- Cap reverse travel at 10–15% of total machine travel.
- Limit travel speed on rocky or abrasive ground to reduce impact loading.
- Prohibit hard-radius pivot turns on abrasive soil; use wider arcs.
- Implement a structured operator coaching program tied to telematics data. Operator behavior is the fastest-changing variable in the wear equation, and coaching produces measurable results quickly.
Track small-component swaps (rollers, idlers) as planned work orders, not reactive repairs. A roller replaced at 70% worn costs a fraction of the cascading damage it prevents.
Should you rebuild the undercarriage or replace the machine?
The rebuild-vs.-replace decision comes down to three numbers: percent-worn on the undercarriage, estimated remaining productive life of the machine, and the cost of the rebuild relative to that remaining value. Decision-tree and cost-minimization models are the standard academic approach to this problem, and the logic translates directly to a field checklist.
| Decision Factor | Rebuild Indicator | Replace Indicator |
|---|---|---|
| Undercarriage percent-worn | moderate wear; machine otherwise sound | near or at full wear; multiple components at end of life simultaneously |
| Machine structural condition | frame, hydraulics, and powertrain in good condition | major structural or powertrain defects alongside undercarriage wear |
| Remaining productive life | several thousand hours of productive work expected post-rebuild | limited useful work expected |
| Rebuild cost vs. machine value | rebuild cost is substantially less than current machine value | rebuild cost approaches or exceeds machine replacement cost |
| Downtime impact | rebuild can be scheduled within a planned window | urgent failure with no scheduled window available |
A simple illustrative example: a crawler dozer with moderately worn bushings and rollers approaching replacement. A full undercarriage rebuild typically costs tens of thousands of dollars depending on component pricing and labor. If the machine has significant productive life remaining and the powertrain is sound, that rebuild cost spread over remaining hours may be far lower than the daily cost of a rental replacement or a new machine purchase. The rebuild is justified. If the same machine has a cracked final drive housing and the frame shows stress fractures, the math reverses.
The key timing discipline: once inspection data flags a machine for rebuild, schedule the work within a 4–6 week window. Waiting longer allows wear to accelerate past the rebuild threshold and forces a more expensive intervention or an unplanned failure on a job site.
Key Takeaways
Consistent hour logging, scheduled measurement, and a clear rebuild threshold are the three pillars of a program that actually extends tracked equipment life.
| Point | Details |
|---|---|
| Log hours from day one | Record engine hours at every inspection; telematics automates this and removes human error. |
| Inspect on a 250/500-hour cycle | Visual checks at 250 hours and full measurements at 500 hours catch wear before it cascades. |
| Sand content drives wear rate | High soil sand content accelerates bushing and sprocket degradation; plan for 70–80% of optimistic life on abrasive sites. |
| Rebuild when cost is under 50% of machine value | A rebuild is justified when the machine has substantial productive life remaining and rebuild cost stays below half the machine’s current value. |
| Motowatchdog for hour and duty logging | Motowatchdog’s subscription-free GPS devices capture engine hours, idle time, geofenced duty, and maintenance reminders with no ongoing fees. |
Why condition data is only as good as your execution window
Most fleets that invest in condition monitoring fail at the same point: the data identifies a problem, and nothing happens for six weeks because no one owns the repair slot. The monitoring investment yields almost nothing if the maintenance process cannot schedule and execute repairs inside the window the data identifies. That window is often 4–6 weeks from the alert to the repair. Miss it, and the wear that was manageable becomes a forced rebuild.
The organizational change required is specific. Assign one person ownership of each flagged machine. Define what “actionable” means in your shop: a written work order, a parts order, and a scheduled bay date, all within the window. Establish a weekly reporting cadence where inspection data is reviewed against open work orders. Without that cadence, condition data becomes a filing exercise rather than a maintenance tool.
Expect false positives early, especially from condition sensors. A 14–30 day burn-in baseline period before enabling alerts is not optional; it is the difference between a system technicians trust and one they ignore. The same discipline applies to telematics-based PM triggers: validate that the hour readings match physical meter readings on the first three machines before rolling the system fleet-wide.
The fleets that get the most from monitoring programs are not the ones with the most sensors. They are the ones with the clearest execution workflow tied to the data.
Motowatchdog makes it easy to start logging hours today
The biggest gap in most tracked-equipment programs is not inspection knowledge. It is the absence of reliable, automatic hour logging that triggers PM schedules without relying on operators to self-report. Motowatchdog fills that gap with subscription-free GPS devices that run on a one-time hardware purchase, no monthly fees, and a companion app your fleet manager and lead mechanic can both access.
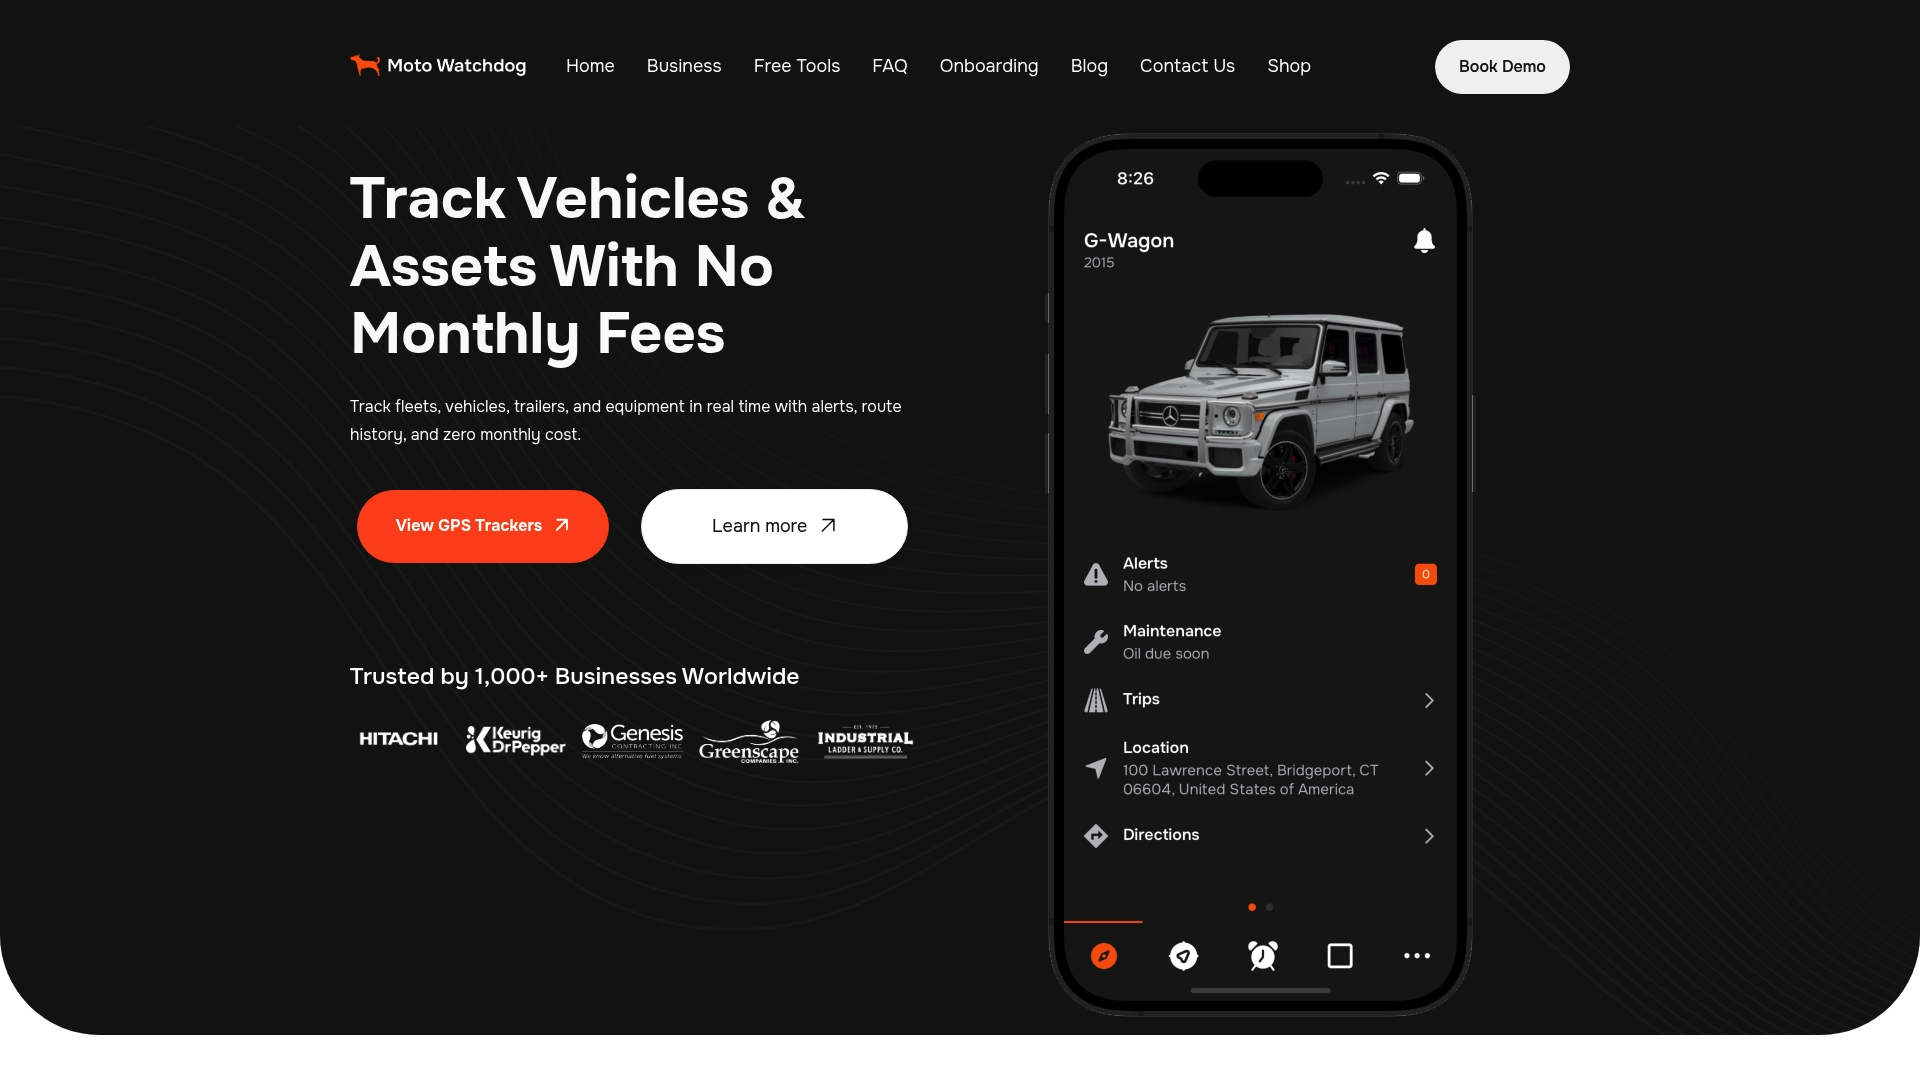
Key features aligned to the monitoring program in this guide:
- Fleet data export: — Pull hour and duty data into your CMMS or spreadsheet for trend analysis.
Start with three to five of your highest-risk tracked machines for 30–60 days. Validate that engine-hour readings match physical meter readings, confirm geofence duty is capturing site time correctly, and then scale to the full fleet. Involve your fleet manager, lead mechanic, and procurement contact from day one so the data feeds directly into parts ordering and scheduling decisions. Explore Motowatchdog’s subscription-free GPS tracking and get your first pilot machines logging hours this week.
Useful sources and further reading
The sources below are organized by type: standards, academic research, and industry guidance. Consult your OEM maintenance manual for machine-specific tolerances before applying any threshold from this article to a specific model.
Standards:
- ISO 20816: Condition Monitoring and Diagnostics of Machines — The governing standard for vibration measurement, sensor selection, mounting practices, and alarm threshold methodology. Reference this when deploying any vibration-based monitoring on rollers or idlers.
Academic research:
- Managing the Wear of Heavy Construction Equipment Steel Track Undercarriage by Soil Sand Content — Indiana State University thesis covering ultrasonic percent-worn measurement, bushing turn scheduling, and the relationship between soil composition and wear rate.
- A study on factors affecting the wear of steel track undercarriage — Peer-reviewed study with regression modeling of sand content vs. wear rate; use this when estimating adjusted life expectancy on sandy job sites.
- A study on the factors affecting the economical life of heavy construction equipment — IAARC paper on decision-tree and cost-minimization models for replacement timing; useful background for the rebuild-vs.-replace framework.
Industry guidance:
- Heavy Equipment Maintenance: Construction, Mining & Earthmoving Fleet CMMS — Practical PM interval guidance (250/500/1,000-hour triggers), undercarriage cost share data, and telematics integration case descriptions.
- How to calculate an asset’s life expectancy — Infraspeak guide on blending OEM intervals with site-specific telemetry for usage-based maintenance planning.
- Motowatchdog subscription-free GPS for businesses — Product resource describing Motowatchdog’s hour logging, geofence, maintenance reminder, and data export features for fleet managers.