How to start saving money
Lorem ipsum dolor sit amet, consectetur adipiscing elit lobortis arcu enim urna adipiscing praesent velit viverra sit semper lorem eu cursus vel hendrerit elementum morbi curabitur etiam nibh justo, lorem aliquet donec sed sit mi dignissim at ante massa mattis.
- Neque sodales ut etiam sit amet nisl purus non tellus orci ac auctor
- Adipiscing elit ut aliquam purus sit amet viverra suspendisse potent
- Mauris commodo quis imperdiet massa tincidunt nunc pulvinar
- Excepteur sint occaecat cupidatat non proident sunt in culpa qui officia
Why it is important to start saving
Vitae congue eu consequat ac felis placerat vestibulum lectus mauris ultrices cursus sit amet dictum sit amet justo donec enim diam porttitor lacus luctus accumsan tortor posuere praesent tristique magna sit amet purus gravida quis blandit turpis.

How much money should I save?
At risus viverra adipiscing at in tellus integer feugiat nisl pretium fusce id velit ut tortor sagittis orci a scelerisque purus semper eget at lectus urna duis convallis. porta nibh venenatis cras sed felis eget neque laoreet suspendisse interdum consectetur libero id faucibus nisl donec pretium vulputate sapien nec sagittis aliquam nunc lobortis mattis aliquam faucibus purus in.
- Neque sodales ut etiam sit amet nisl purus non tellus orci ac auctor
- Adipiscing elit ut aliquam purus sit amet viverra suspendisse potenti
- Mauris commodo quis imperdiet massa tincidunt nunc pulvinar
- Adipiscing elit ut aliquam purus sit amet viverra suspendisse potenti
What percentege of my income should go to savings?
Nisi quis eleifend quam adipiscing vitae aliquet bibendum enim facilisis gravida neque. Velit euismod in pellentesque massa placerat volutpat lacus laoreet non curabitur gravida odio aenean sed adipiscing diam donec adipiscing tristique risus. amet est placerat in egestas erat imperdiet sed euismod nisi.
“Nisi quis eleifend quam adipiscing vitae aliquet bibendum enim facilisis gravida neque velit euismod in pellentesque”
Do you have any comments? Share them with us on social media
Eget lorem dolor sed viverra ipsum nunc aliquet bibendum felis donec et odio pellentesque diam volutpat commodo sed egestas aliquam sem fringilla ut morbi tincidunt augue interdum velit euismod eu tincidunt tortor aliquam nulla facilisi aenean sed adipiscing diam donec adipiscing ut lectus arcu bibendum at varius vel pharetra nibh venenatis cras sed felis eget.
Equipment utilization tracking measures actual use (engine hours, miles, trips) against planned use so managers can spot underused assets, cut idle and fuel costs, and make right-sizing decisions with real numbers instead of guesswork. Done well, it turns fleet management from reactive problem-solving into data-driven decision-making. Done poorly, with location data alone, it produces numbers that look precise but mislead.
TL;DR:
- Tracking both deployment and utilization separately is essential for accurately assessing equipment needs and avoiding misleading data from location-only tracking.
- Utilizing a baseline planned-hours figure from manufacturer specifications or historical peak data ensures meaningful comparison and two consecutive underuse periods signal disposal candidates.
- Effective implementation involves starting with a focused pilot, verifying data accuracy, and limiting conclusions until at least six weeks of clean data are collected.
- Combining GPS location data with engine-hour sensors or telematics provides the most reliable utilization metrics, especially for powered assets, reducing false utilization signals.
- Small fleets can start measuring utilization with subscription-free GPS trackers for mileage and geofencing, scaling to full telematics as needs grow.
Table of Contents
- What equipment utilization tracking is, and how it differs from deployment
- Key metrics and formulas for measuring utilization
- How to implement a utilization tracking program
- Reporting, dashboards, and the KPIs worth watching
- Business outcomes and use cases worth tracking toward
- Common mistakes and data pitfalls to avoid
- Where subscription-free GPS tracking fits into a utilization program
- A 90-day checklist for getting utilization tracking right
- Start tracking utilization without adding a monthly bill
- FAQ
- Sources
What equipment utilization tracking is, and how it differs from deployment
Utilization and deployment sound interchangeable, but they measure two different things, and confusing them is one of the most common reasons fleet data misleads rather than informs.
Deployment describes whether a piece of equipment is at a job site where it’s needed. A dozer sitting in the right location, hooked up and ready, counts as deployed, even if its engine never turns over that day. Utilization describes whether it’s actually working, measured in engine hours, miles, or completed trips against what you planned for.
Construction Equipment explains that deployment and utilization must be tracked separately and then multiplied together to get expected annual hours, the baseline you need for rate recovery and ownership-cost calculations. A machine can be fully deployed and poorly utilized, or rarely deployed but intensively used when it is. Either pattern tells you something different about whether you own the right equipment.
The AEMP/CFMA Heavy Equipment Comparator treats “actual hours versus planned hours” as the standard definition of utilization across the industry, which matters because it gives fleets a common language for benchmarking against peers rather than inventing their own metric.
A few practical examples clarify the distinction:
- A paving crew’s roller shows 100% deployment (it’s on every job) but 40% utilization (it sits idle between passes).
- A rental yard’s mini excavator shows low deployment (rarely checked out) but near 100% utilization whenever it leaves the yard.
- A municipal truck shows high deployment and high utilization, meaning it’s both needed and worked hard, a strong candidate for replacement planning rather than reduction.
Tracking both numbers, not just one, is what lets you tell the difference between an asset you don’t need and one you’re simply using inefficiently.
Key metrics and formulas for measuring utilization
Once you accept the deployment and utilization distinction, the next step is deciding exactly what to measure and how to calculate it. A handful of core metrics cover most fleet situations.
- Engine hours: total time the engine runs, the backbone metric for utilization on powered equipment.
- Idle percentage: the share of engine-on time where the machine isn’t moving or working, a direct signal of wasted fuel.
- Miles or trips: distance traveled or discrete jobs completed, more relevant for transport assets than stationary equipment.
- Days used: how many calendar days an asset actually operated during a reporting period, useful for seasonal equipment.
- Utilization percentage: actual hours divided by planned hours, the headline number that ties everything together.
The core formula, drawn from standard fleet practice, is straightforward:
Utilization % = Actual Hours ÷ Planned Hours
And deployment multiplies against it to project expected annual hours, following the method Construction Equipment describes:
Expected Annual Hours = Deployment Weeks × Weekly Utilization Hours
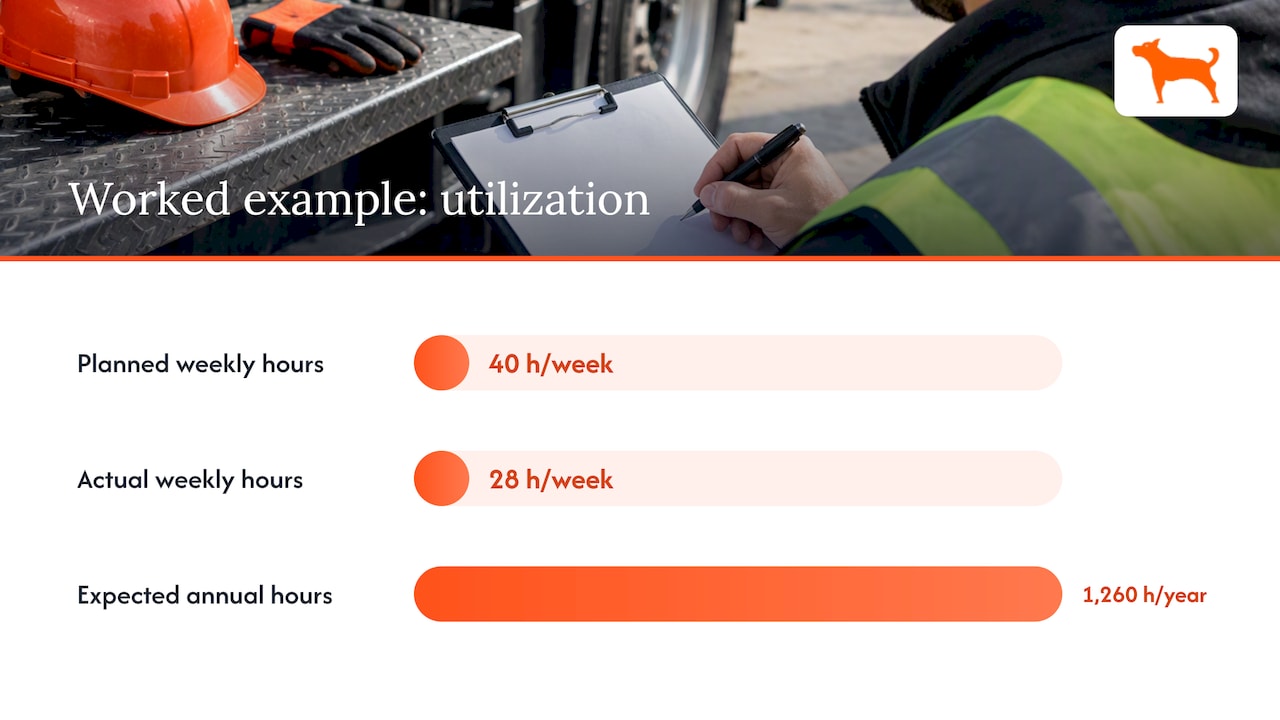
Worked example: say a skid steer is planned for 40 engine hours per week. Telematics data shows it actually ran 28 hours last week. Utilization comes out to 28 ÷ 40 = 70%. If that skid steer is deployed 45 weeks a year and averages those 28 hours when it’s deployed, expected annual hours land at 45 × 28 = 1,260 hours, a number you can compare directly against the depreciation schedule and maintenance intervals the manufacturer built the machine for.
Pro Tip: Set your planned-hours baseline using the manufacturer’s rated duty cycle for that asset class, not last year’s actual hours, or you’ll be benchmarking against your own inefficiency instead of a real target.
Equipment that runs under 50% of planned hours for two consecutive reporting periods is a strong candidate for reassignment or disposal, according to the utilization-versus-planned framework the AEMP/CFMA comparator uses to benchmark fleets, a threshold that gives managers an objective trigger instead of a subjective hunch.
Baseline accuracy matters as much as the formula itself. A planned-hours figure pulled from a rental catalog or an old spreadsheet will skew every utilization percentage downstream. Pull baseline figures from original equipment specifications, your own historical peak-season data, and the job types the asset was actually purchased to perform, then revisit that baseline annually as fleet composition and work volume shift.
How to implement a utilization tracking program
A utilization program succeeds or fails on the rollout plan, not the hardware. Start small, validate the data, then scale.
Pilot checklist:
- Define the goal: reduce idle time, right-size the fleet, or recover ownership costs through rate adjustments.
- Select 10 to 20 representative assets across your major equipment classes, not just the newest or easiest to reach.
- Run the pilot for 60 to 90 days, long enough to cover a full work cycle and at least one slow period.
- Set success criteria before you start: a target utilization percentage, an idle-reduction goal, or a specific number of underused assets identified.
Device-selection checklist:
- Confirm the device captures engine-on status, not just GPS location, for every powered asset in scope.
- Decide between hardwired installation for continuous power or battery units for faster deployment on trailers and towables.
- Check the reporting cadence: real-time alerts matter for theft and geofencing, while hourly or daily summaries are usually enough for utilization trending.
- Verify API or export access so telematics data can flow into existing maintenance and accounting systems rather than living in a standalone dashboard.
Integration is where many programs stall. Telematics data only becomes decision-useful once it connects to maintenance schedules and cost reporting. A tracker that flags 1,200 engine hours means little on its own, but paired with a maintenance system that triggers service at 1,250 hours, it becomes an automated workflow instead of a manual lookup. Exportable reports and API access, covered in more detail in a practical guide to fleet tracking data export, let you pull utilization figures directly into the spreadsheets or ERP systems your finance team already uses for job costing.
Governance determines whether the data stays trustworthy after the pilot ends. Assign one person as the data owner responsible for reviewing exceptions and resolving tagging errors. Set a review cadence, weekly during the pilot and monthly once the program stabilizes, so the data gets looked at regularly rather than accumulating unreviewed. Reconcile telematics-reported hours against job-cost reports and time sheets periodically; academic telematics research published in the Journal of Computing in Civil Engineering specifically recommends this kind of cross-check to catch sensor failures or data gaps before they distort fleet-wide utilization assessments. Finally, train the staff who’ll interact with the system daily, operators who mount or dismount devices, dispatchers who read the dashboards, and finance staff who pull reports for billing.
Reporting, dashboards, and the KPIs worth watching
A dashboard only earns its place if it changes what someone does on a Monday morning. The most useful utilization dashboards keep a tight set of widgets front and center:
- Utilization percentage by asset and by class, so you can spot outliers at a glance.
- Deployed weeks per asset, paired against utilization to separate “not needed” from “needed but underworked.”
- Underused assets list, anything below your threshold for two or more consecutive periods.
- Idle hours and idle percentage, the fastest-moving fuel-cost lever on the dashboard.
- Cost per hour, blending fuel, maintenance, and depreciation against actual engine hours.
Internal benchmarks should come from your own fleet’s history once you have at least one full seasonal cycle of clean data. External benchmarks add context: the AEMP/CFMA Heavy Equipment Comparator tracks 32 KPIs across fleets and gives managers a way to compare their utilization percentage against industry peers rather than against an arbitrary internal guess. Use external benchmarks to sanity-check your targets, not to replace them, since duty cycles and climate vary enough between operations that a peer average isn’t automatically your right number.
Municipal fleets that acted on telematics data by removing a number of underutilized vehicles saved an estimated maintenance costs annually, according to an OSTI case study on vehicle telematics cost savings, a result that only happened because someone reviewed the dashboard and acted on it.
Cadence matters as much as content. Review idle and utilization figures weekly during active season, distribute a monthly summary to operations and finance, and run a quarterly deep dive with procurement to inform purchasing and disposal decisions for the next cycle.
Business outcomes and use cases worth tracking toward
Utilization data pays for itself fastest when it drives a specific decision, not when it just sits on a dashboard.
- Right-sizing the fleet: identifying assets running below 50% of planned hours and either reassigning, selling, or declining to renew the rental.
- Ownership-cost recovery: using expected annual hours (deployment times utilization) to set internal billing rates that actually reflect how hard a machine works.
- Maintenance optimization: triggering service based on actual engine hours rather than calendar time, which prevents both premature service and missed intervals.
- Theft and unauthorized-use reduction: geofencing alerts that flag when equipment leaves a job site boundary outside working hours.
The municipal example above, removing underused vehicles for an estimated $90,750 in annual maintenance savings, shows the pattern clearly: the savings came from acting on the data, not from owning the tracker. Construction firms apply the same logic to right-size excavator and loader fleets against actual project load. Restoration and remediation contractors, whose equipment sits idle between callouts, use utilization percentage to decide what to own versus rent on demand. Equipment rental companies use the same metrics in reverse, tracking which units in their own fleet justify replacement versus retirement. Municipal fleets apply it to everything from plow trucks to mowers, where seasonal utilization swings make planned-hours baselines especially important to get right.
Common mistakes and data pitfalls to avoid
Location-only tracking is the single most common mistake. A truck parked at a job site for six hours looks “deployed” on a map, but without engine-on data you can’t tell if it worked, idled, or sat shut off, which overstates utilization and hides fuel waste.
Data hygiene problems compound the issue: mislabeled assets, telemetry gaps from dead batteries, or a device swapped between machines without updating the record. Each of these quietly corrupts the utilization percentage without triggering an obvious alarm.
- Tag every asset with a unique, verified ID at installation, and audit tags quarterly against the physical fleet.
- Flag telemetry gaps longer than 24 hours automatically rather than waiting for a monthly report to surface them.
- Reconcile telematics hours against job-cost reports and time sheets at least monthly to catch sensor drift or misuse early.
Pro Tip: Run a spot-check every quarter where someone physically verifies three to five assets against what the dashboard reports, a small habit that catches tagging and sensor errors before they skew a full year of data.
Where subscription-free GPS tracking fits into a utilization program
Not every fleet needs a full telematics platform with recurring fees to start measuring utilization. For small contractor fleets, trailers, and portable equipment, a subscription-free GPS tracker can cover the core data points, mileage, trip history, and geofenced location, without adding a monthly line item to the budget.
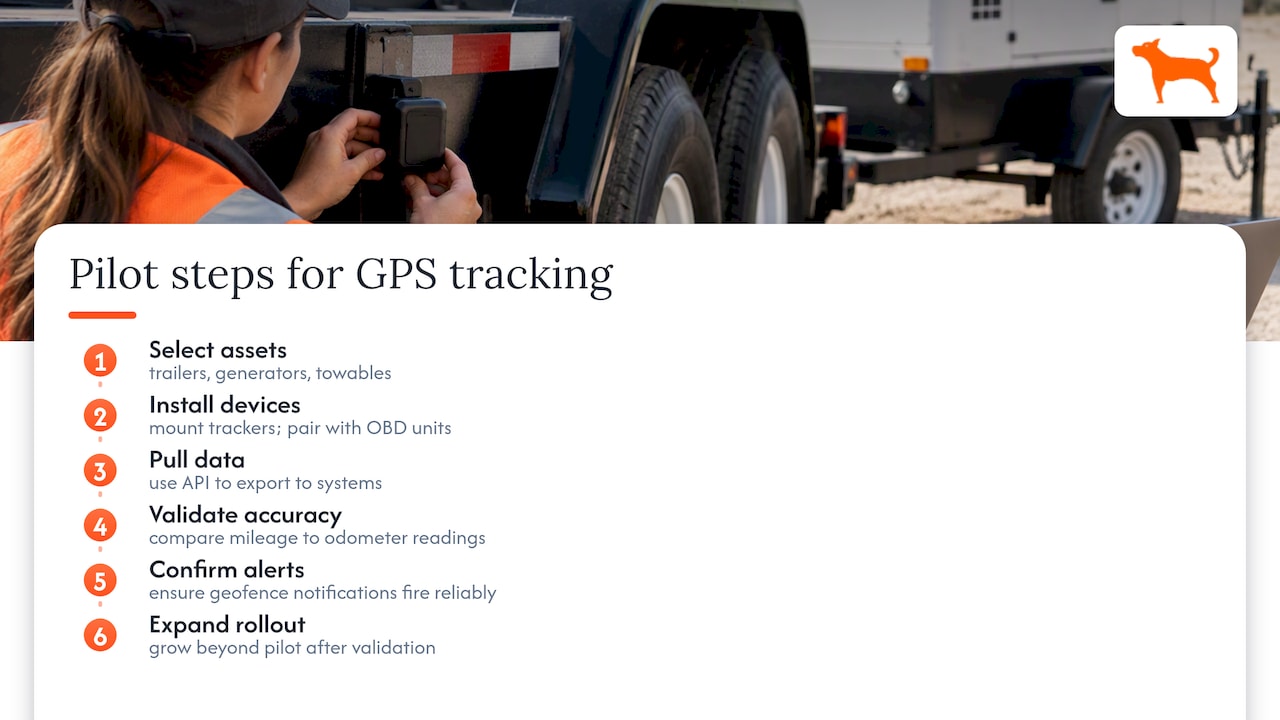
We build our trackers around that gap: real-time location, customizable geofencing, long battery life, and mileage reporting that simplifies the reporting work managers already have to do. Our API access through the business page lets fleets pull that data into existing maintenance and cost systems rather than reading it off a standalone app. For a pilot program, this kind of device fits best on trailers, generators, and towables where engine-hour sensors aren’t available, placed alongside hardwired OBD units on powered equipment. During a trial, validate mileage accuracy against odometer readings and confirm geofence alerts fire reliably before expanding past the pilot group. A closer look at how lifetime GPS tracking without fees works covers the tradeoffs in more detail.
A 90-day checklist for getting utilization tracking right
Most utilization programs fail not from bad technology but from skipping the sequence. Here’s the order I’d follow if I were starting from zero.
Pick 10 to 15 pilot assets that represent your highest-cost equipment classes, not just the easiest to reach. Install devices in week one and spend week two confirming engine-on data is actually capturing correctly, not just location pings. Run weekly utilization reports from week three onward, and resist the urge to draw conclusions before you have at least six weeks of clean data. By day 90, you should have a defensible utilization percentage for each pilot asset and a short list of underused equipment to present to stakeholders.
Success at this stage isn’t a perfect dashboard. It’s a handful of specific, defensible numbers, one or two assets you can confidently recommend reassigning or selling, which is the fastest way to earn budget for a full rollout.
— Louis
Start tracking utilization without adding a monthly bill
We offer trackers designed to provide reliable engine and location data without recurring subscriptions, including features such as 4G data, customizable geofencing, and mileage reporting to simplify pilot program reporting.
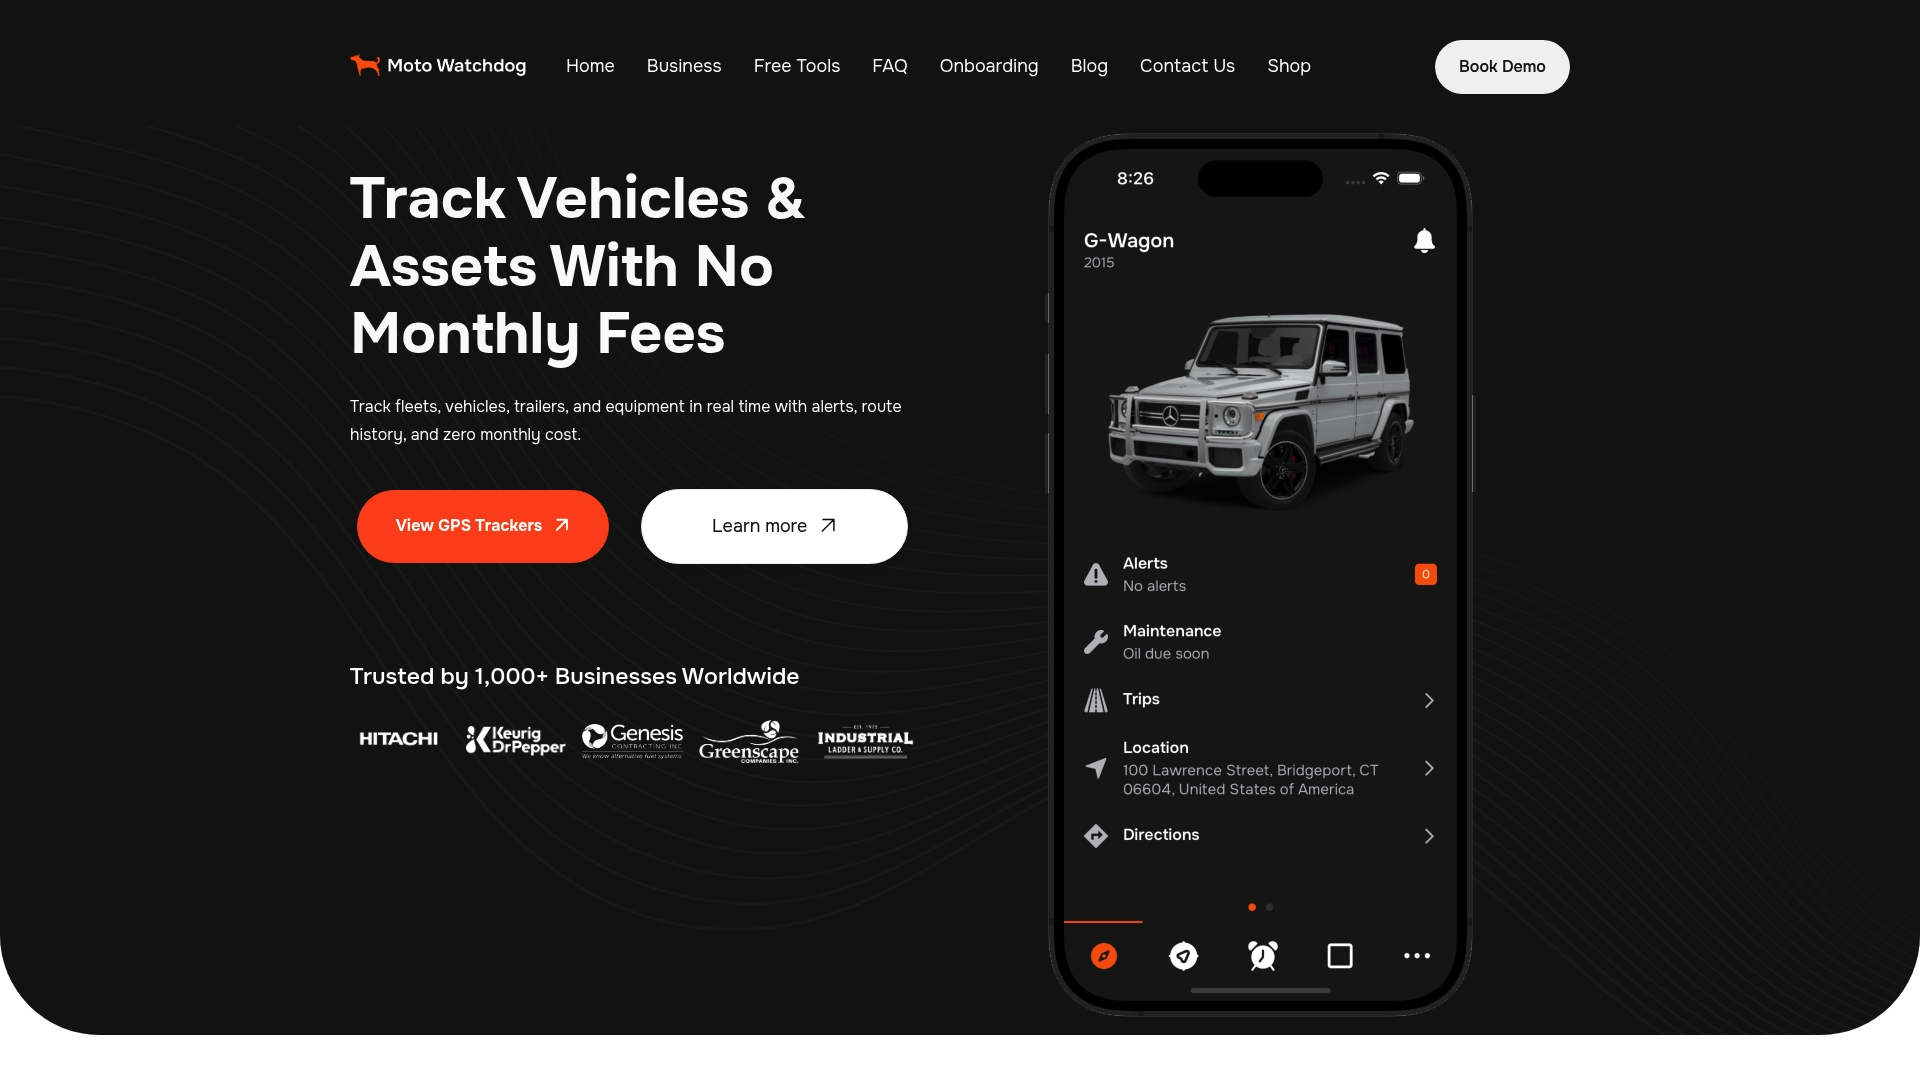
- Trackers start from $124.99 one-off, with no monthly fee, on our trackers page.
- Contractor and small-fleet use cases are covered in detail on our contractor vehicle tracking page.
If you’re ready to pilot utilization tracking on a handful of assets, evaluate our trackers and see where they fit alongside the engine-hour sensors already in your fleet.
FAQ
What is the best software for tracking equipment inventory?
There’s no single best platform for every fleet; the right choice depends on whether you need engine-hour data, yard-level inventory, or both. Look for software that integrates GPS or OBD telematics with exportable reports, since standalone inventory lists without usage data won’t show you utilization.
What is equipment utilization?
Equipment utilization is the percentage of actual operating hours compared to planned hours for a given asset, a standard defined by the AEMP/CFMA Heavy Equipment Comparator. It tells you whether a deployed asset is actually being worked, separate from whether it’s at the right job site at all.
What is the best way to track equipment?
The most reliable approach combines GPS or telematics for location with OBD or engine-hour sensors for actual run time, since location data alone can overstate how much an asset is really used. Research from the FHWA and University of Cincinnati recommends this kind of hybrid setup, adding BLE or QR tracking for tools and portable equipment that don’t have an engine to monitor.
What is a machine utilization report?
A machine utilization report summarizes actual engine hours, idle percentage, and deployment weeks against planned targets for a fleet or individual asset over a reporting period. It typically flags underused equipment, highlights idle-time trends, and feeds into decisions about maintenance scheduling, rate recovery, and right-sizing.
Sources
Different devices capture different signals, and the technology you choose determines whether your utilization numbers reflect reality or just location history.
GPS and telematics units report where an asset is and how it moves over time, useful for route history, geofencing, and theft recovery, but location alone doesn’t tell you whether an engine was running. That distinction matters because a truck parked at a job site for eight hours could be idling the whole time, working intermittently, or shut off entirely, and a GPS-only device can’t tell those apart.
OBD-connected trackers and dedicated engine-hour sensors close that gap by reading directly from the engine control unit or a hardwired ignition sense wire, capturing actual run time rather than inferring it from movement. Department of Energy telematics guidance recommends exactly this combination, miles, trips, engine hours, and fuel or energy consumption together, as the data set that supports right-sizing and acquisition decisions, rather than location data in isolation.
For smaller tools and portable equipment that don’t have an engine to tap into, Bluetooth Low Energy (BLE) beacons and QR or barcode scan workflows fill the inventory gap. BLE tags report presence within a yard or job site zone, while QR-based check-in and check-out systems log who took what equipment and when, both useful for tool-level accountability where a GPS unit would be overkill.
- 2023 Heavy Equipment Comparator: Key Performance Insights Across 32 KPIs - Association of Equipment Management Professionals (AEMP)
- How to measure equipment deployment and utilization in construction fleets - Construction Equipment
- Utilizing Telematics Data to Support Effective Equipment Fleet-Management Decisions | Journal of Computing in Civil Engineering
Research from the FHWA and University of Cincinnati recommends a hybrid approach, GPS paired with BLE and custom integration software, rather than relying on a single device type, because different asset classes need different signals. A hardwired or OBD-connected tracker on a powered machine captures engine hours precisely, while battery-powered GPS or BLE tags handle trailers, generators, and hand tools that have no engine to monitor.
Tradeoffs worth weighing before you buy: hardwired units need professional installation but deliver continuous power and reliable cadence; battery units install in minutes but need a replacement or recharge schedule; cellular coverage gaps in remote job sites can delay data transmission regardless of device type; and tamper risk rises for any unit mounted somewhere accessible to a motivated thief. A hardwiring guide for fleet managers walks through mounting and power considerations in more depth, while a guide to small-equipment GPS covers battery and BLE options for tools that never see an engine bay.