How to start saving money
Lorem ipsum dolor sit amet, consectetur adipiscing elit lobortis arcu enim urna adipiscing praesent velit viverra sit semper lorem eu cursus vel hendrerit elementum morbi curabitur etiam nibh justo, lorem aliquet donec sed sit mi dignissim at ante massa mattis.
- Neque sodales ut etiam sit amet nisl purus non tellus orci ac auctor
- Adipiscing elit ut aliquam purus sit amet viverra suspendisse potent
- Mauris commodo quis imperdiet massa tincidunt nunc pulvinar
- Excepteur sint occaecat cupidatat non proident sunt in culpa qui officia
Why it is important to start saving
Vitae congue eu consequat ac felis placerat vestibulum lectus mauris ultrices cursus sit amet dictum sit amet justo donec enim diam porttitor lacus luctus accumsan tortor posuere praesent tristique magna sit amet purus gravida quis blandit turpis.

How much money should I save?
At risus viverra adipiscing at in tellus integer feugiat nisl pretium fusce id velit ut tortor sagittis orci a scelerisque purus semper eget at lectus urna duis convallis. porta nibh venenatis cras sed felis eget neque laoreet suspendisse interdum consectetur libero id faucibus nisl donec pretium vulputate sapien nec sagittis aliquam nunc lobortis mattis aliquam faucibus purus in.
- Neque sodales ut etiam sit amet nisl purus non tellus orci ac auctor
- Adipiscing elit ut aliquam purus sit amet viverra suspendisse potenti
- Mauris commodo quis imperdiet massa tincidunt nunc pulvinar
- Adipiscing elit ut aliquam purus sit amet viverra suspendisse potenti
What percentege of my income should go to savings?
Nisi quis eleifend quam adipiscing vitae aliquet bibendum enim facilisis gravida neque. Velit euismod in pellentesque massa placerat volutpat lacus laoreet non curabitur gravida odio aenean sed adipiscing diam donec adipiscing tristique risus. amet est placerat in egestas erat imperdiet sed euismod nisi.
“Nisi quis eleifend quam adipiscing vitae aliquet bibendum enim facilisis gravida neque velit euismod in pellentesque”
Do you have any comments? Share them with us on social media
Eget lorem dolor sed viverra ipsum nunc aliquet bibendum felis donec et odio pellentesque diam volutpat commodo sed egestas aliquam sem fringilla ut morbi tincidunt augue interdum velit euismod eu tincidunt tortor aliquam nulla facilisi aenean sed adipiscing diam donec adipiscing ut lectus arcu bibendum at varius vel pharetra nibh venenatis cras sed felis eget.
A fleet management dashboard KPI is a key metric that allows managers to track the efficiency, cost, and performance of their fleet in real time. These KPIs provide actionable insights that help reduce expenses, improve maintenance schedules, and optimize vehicle utilization.
Without clear KPIs on a dashboard, it becomes difficult to identify issues or measure improvements effectively.
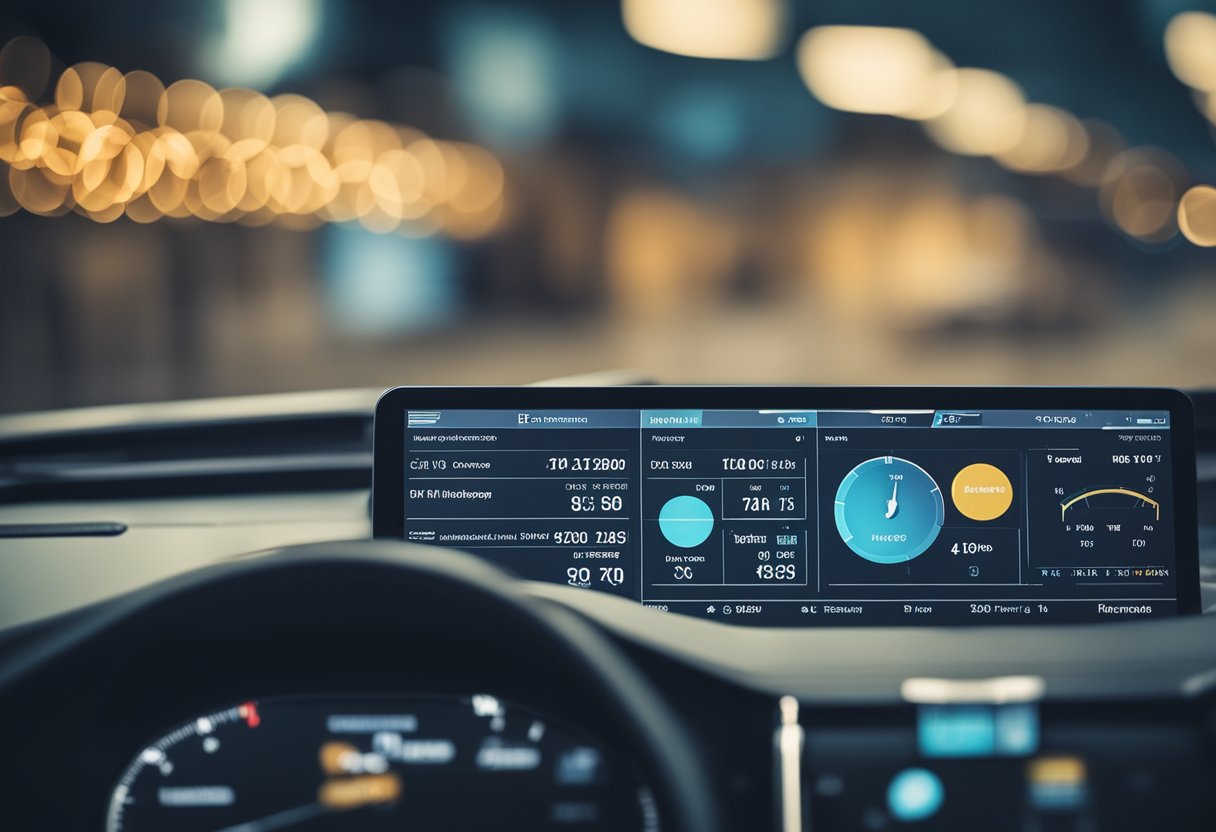
The dashboard consolidates data like fuel efficiency, vehicle usage, maintenance status, and total cost of ownership into a visual format. This enables quick decision-making and helps managers stay aligned with budget and operational goals.
Tracking these KPIs consistently supports better control over fleet operations and drives strategic planning. For more about key KPIs, see fleet management KPI guides like those available at Fleetio and Fleetpal.
Understanding Fleet Management Dashboards

Fleet management dashboards provide a centralized view of key performance indicators (KPIs) and operational data. They allow managers to track vehicle health, driver behavior, fuel usage, and maintenance schedules in real time.
This promotes informed decisions and cost control.
Definition and Purpose
A fleet management dashboard is a digital interface that consolidates data from various fleet operations into a single platform. It transforms raw data into visual elements like charts, graphs, and alerts.
This dashboard’s purpose is to offer quick access to critical information, enabling efficient monitoring and management. By having all relevant information displayed clearly, it helps reduce manual reporting and improves response times.
It supports proactive maintenance, compliance tracking, and fuel efficiency management. The real-time nature ensures that issues are addressed promptly, limiting downtime and expenses.
Key Features of a Dashboard
Key features of a fleet management system’s dashboard include real-time data visualization, customizable KPI tracking, and alert notifications. Common KPIs shown are fuel consumption, vehicle utilization, driver safety scores, and maintenance status.
Dashboards often include interactive maps showing vehicle locations and routes. Integration with telematics devices is standard, allowing seamless data flow.
User-friendly design supports role-based access, meaning managers see relevant data specific to their responsibilities. Analytics tools within dashboards help identify trends and inefficiencies, guiding strategic fleet decisions.
Clear visualization and concise metrics streamline daily operations and long-term planning.
Role in Fleet Management
Fleet management dashboards serve as the operational nerve center for fleet managers. They consolidate performance metrics and operational alerts to support timely decision-making.
Dashboards reduce the complexity of managing multiple vehicles and drivers by presenting the most critical KPIs at a glance. Their role extends to cost control by highlighting areas such as excess fuel consumption or delayed maintenance.
They improve safety by tracking driver behavior and compliance with regulations. Dashboards also facilitate reporting to stakeholders through automated data summaries, saving time and resources.
Using a KPI dashboard helps align fleet activities with business goals, increasing both productivity and accountability in fleet operations. For more on the topic, explore detailed insights on fleet management dashboards.
What Are KPIs in Fleet Management?

Effective fleet management depends on measuring specific metrics that reflect performance and operational efficiency. These measurements help managers control costs, optimize vehicle use, and maintain safety standards.
Definition of Key Performance Indicators
Key Performance Indicators (KPIs) are quantifiable measures used to evaluate how well fleet operations meet set objectives. They provide clear data points that reflect important aspects like cost, productivity, and safety.
Each KPI focuses on a specific area to help managers track progress and identify issues. KPIs can be financial, such as maintenance expenses, or operational, like vehicle utilization rates.
Organizations select KPIs based on their strategic goals to ensure relevant and actionable insights.
Common Fleet KPIs
Common KPIs in fleet management include:
- Fuel Consumption: Measures fuel efficiency to identify savings opportunities.
- Vehicle Utilization: Tracks the percentage of time vehicles are actively in use.
- Total Cost of Ownership (TCO): Combines all expenses related to a vehicle over its lifecycle.
- Maintenance Costs: Reflects spending on repairs and upkeep.
- Driver Safety: Records incidents and compliance with safety protocols.
- Budget Adherence: Measures actual spending against planned budgets.
These indicators offer a broad yet focused view to optimize fleet performance across costs, usage, and safety.
Importance of KPIs for Fleet Operations
KPIs enable data-driven decisions, which improve management efficiency and fleet effectiveness. By monitoring KPIs, operators can reduce unnecessary expenditures and avoid vehicle downtime through timely maintenance.
KPIs also support regulatory compliance and risk management by tracking driver behavior and safety incidents. Regular review of KPIs ensures that fleet strategies stay aligned with business goals.
Using KPIs as benchmarks promotes accountability and continuous improvement within fleet operations.
Types of KPIs for Fleet Management Dashboards

Effective fleet management relies on a range of key performance indicators that track vehicle use, driver behavior, legal requirements, and service quality. These KPIs must deliver precise, actionable data to improve operations, minimize risks, and meet customer expectations.
Efficiency KPIs
Efficiency KPIs measure how well a fleet utilizes its resources to reduce costs and increase productivity. Common metrics include vehicle utilization rates, which show the percentage of time vehicles are actively used versus idle.
Monitoring fuel economy is essential to control fuel consumption and identify inefficient driving patterns or vehicle issues. Another critical metric is maintenance costs and downtime, which tracks expenses and time lost due to repairs or scheduled servicing.
Keeping downtime minimal ensures high fleet availability. Route optimization metrics also help reduce travel time, lower fuel consumption, and increase delivery capacity.
Relevant data supports decisions on vehicle replacements to avoid excessive costs from aging or underperforming units. This maintains an optimal fleet size for operational demands.
Safety KPIs
Safety KPIs track factors that influence accident rates, driver behavior, and overall risk reduction. Key metrics include incident reports such as accidents and near-misses, which help identify high-risk drivers or routes.
Monitoring harsh braking, acceleration, and cornering events pinpoints unsafe driving habits and helps design targeted training programs. Wearable or in-vehicle monitoring systems often feed data to these KPIs, enabling real-time alerts.
Tracking driver licensing and certification status ensures only qualified personnel operate vehicles. Lower accident rates result from continuous safety monitoring and preventative actions.
Compliance KPIs
Compliance KPIs ensure the fleet adheres to legal and regulatory requirements. This includes keeping track of vehicle inspection dates, driver hours in line with Hours of Service (HOS) regulations, and emissions standards compliance.
Timely vehicle inspections and maintenance keep the fleet road-legal. Driver compliance includes monitoring valid licenses, certifications, and completion of mandatory safety training.
These KPIs also cover adherence to internal company policies, helping avoid fines and operational disruptions. Accurate compliance tracking supports audit readiness and demonstrates commitment to safety and regulations.
Customer Service KPIs
Customer service KPIs evaluate the fleet’s ability to meet delivery times and service quality. On-time delivery rate is a critical indicator, showing the percentage of shipments arriving within the promised window.
High on-time performance increases customer satisfaction and repeats business. Other metrics include load accuracy and damage rates, which reflect how well cargo is handled and preserved during transportation.
Tracking customer complaints related to delivery helps identify operational issues causing dissatisfaction. Real-time shipment tracking and proactive notifications improve transparency, creating a better experience for customers and clients.
Measuring and Monitoring Metrics

Effective fleet management relies on precise tracking and analysis of operational data. The ability to gather, process, and visualize key performance indicators supports timely decision-making and improves efficiency across the fleet.
Fleet Monitoring Tools
Fleet monitoring tools are essential for capturing accurate data on vehicle location, usage, and condition. GPS tracking devices provide real-time updates on routes and vehicle status.
Additionally, telematics systems collect information on speed, fuel consumption, and engine diagnostics. Integrating these tools allows managers to identify inefficiencies such as unauthorized stops or excessive idling.
Alerts can notify personnel of maintenance needs before failures occur. This proactive approach reduces downtime and lowers repair costs.
Effective fleet monitoring requires reliable hardware and software that integrate smoothly with existing systems. Devices should support remote data transmission and maintain secure, continuous connectivity to ensure data accuracy.
Real-Time Data Analytics
Real-time data analytics transforms raw inputs from fleet monitoring devices into actionable insights. By analyzing live data flows, fleet managers can detect deviations from planned routes, optimize fuel usage, and improve driver behavior.
Analytics platforms apply algorithms to identify trends and anomalies, enabling quick responses to issues like vehicle breakdowns or delays. This minimizes operational disruptions and enhances safety.
The ability to process data instantly supports dynamic decision-making. Real-time analytics also facilitate compliance reporting by automatically tracking metrics such as hours of service and vehicle inspections.
Visualizing Metrics in Dashboards
Dashboards consolidate diverse data streams into a single, intuitive interface. They display critical KPIs such as vehicle utilization, maintenance schedules, and cost per mile using charts, graphs, and tables.
Effective dashboards allow customization to highlight priority metrics based on business objectives. Features like drill-downs enable users to explore underlying data for deeper analysis without switching platforms.
Visual clarity and real-time updates ensure managers can monitor fleet performance continuously.
More details on key performance indicators can be found at Fleetio on fleet management KPIs.
Optimizing Fleet Efficiency Through Dashboards

Fleet management dashboards provide real-time data to support decision-making and improve fleet operations. They highlight key aspects like cost control, operational flow, and risk prevention to maximize productivity.
Reducing Maintenance Costs
Fleet dashboards track vehicle health indicators such as engine hours, tire pressure, and oil levels. By monitoring these KPIs, fleet managers can schedule maintenance before costly repairs occur.
Predictive maintenance alerts reduce unscheduled downtime and repair expenses. Managers can prioritize vehicles needing service, avoiding blanket maintenance that wastes resources.
Maintenance cost benefits include:
- Lower emergency repair spending
- Optimized part replacement timing
- Reduced vehicle downtime
Improving Operational Efficiency
Real-time tracking of vehicle locations, fuel consumption, and driver behavior supports streamlined operations. Dashboards visualize these metrics clearly, enabling managers to identify performance gaps and inefficiencies quickly.
By addressing fuel wastage, inefficient routes, or idle time, fleets can lower operating costs. Efficiency gains also come from better driver management and data-driven scheduling.
Key efficiency metrics tracked are:
MetricImpactFuel usageCost savingsRoute adherenceFaster deliveryIdle timeReduced congestion/emissions
Proactive Warnings and Alerts
Dashboards provide real-time alerts for issues like mechanical faults, speeding, and harsh braking. These warnings enable swift intervention to prevent accidents or costly repairs.
Proactive notifications help enforce compliance with safety and environmental regulations. Managers receive instant updates via email or mobile apps for timely responses.
Common alert types include:
- Engine diagnostics
- Driver behavior infractions
- Vehicle location deviations
Early identification of problems reduces risks and increases fleet reliability.
Ensuring Compliance and Safety

Maintaining strict adherence to legal standards and safety protocols is critical in fleet management. This involves meeting federal mandates, monitoring driver behavior, and producing accurate reports to demonstrate compliance.
These steps reduce risks and support efficient operations.
Federal Regulations
Fleet managers must oversee compliance with federal regulations such as the Federal Motor Carrier Safety Administration (FMCSA) rules. These include Hours of Service (HOS) limits to prevent driver fatigue, Electronic Logging Device (ELD) mandates for recording driving time, and vehicle maintenance standards.
Understanding each regulation's requirements helps avoid costly fines and legal issues. Compliance tracking tools within the dashboard provide real-time alerts on driver hours, inspection due dates, and violations.
Staying ahead of deadlines ensures legal operation across all jurisdictions.
Safety Monitoring
Active safety monitoring focuses on driver behavior and vehicle condition to prevent accidents and ensure road safety compliance. Key performance indicators (KPIs) include seatbelt use, speeding incidents, harsh braking, and acceleration events.
Dashboards integrate data from telematics and onboard sensors. Fleet managers can review driver safety scores and identify coaching needs.
Continuous monitoring encourages adherence to safety protocols.
Regulatory Reporting
Accurate, timely reporting simplifies compliance assurance with federal and local authorities. Fleet management dashboards automate documentation related to inspections, driver logs, and incident reports.
This automation improves efficiency and reduces human error. Detailed reports support audits and investigations by providing clear proof of compliance.
Generating customizable reports ensures fleet managers meet specific regulatory requirements without manual effort.
For further details on tracking compliance KPIs, see 16 Essential Fleet Management KPIs Managers Should Track.
Presenting Dashboard KPIs Effectively

Effective presentation of KPIs ensures fleet managers can quickly interpret and act on data. Clear visual hierarchy, appropriate formats, and targeted reporting methods improve decision-making.
Choosing the right display format and adapting reports for the audience are critical steps in KPI communication.
List View vs. Visual Dashboards
List view organizes KPIs in a straightforward text or table format. It’s useful for precise values, sorting, and quick scanning of raw numbers.
This format benefits users who prefer detail and accuracy over abstraction. Visual dashboards use graphs, charts, and gauges to display KPIs.
They highlight trends and comparisons through color, size, and position, making it easier to spot anomalies and patterns. This method is effective for high-level overviews and periodic reviews.
A balanced dashboard often combines both: a summary visual section with key trends and a detailed list for deeper inspection.
PowerPoint Presentation of KPIs
PowerPoint presentations provide a structured way to communicate KPIs during meetings. They allow for curated storytelling with controlled pacing and context.
Visual elements like charts, infographics, and bullet points help emphasize critical KPIs. Each slide should focus on one key message or metric to avoid overwhelming the audience.
Use consistent color schemes aligned with the fleet management dashboard for familiarity and professionalism. Animations and transitions can highlight changes in KPI trends but should be used sparingly.
Including actionable insights alongside data encourages fleet managers to focus on operational improvements.
Reporting for Fleet Managers
Fleet managers need KPI reports tailored to operational decision-making. Reports should emphasize actionable metrics such as vehicle utilization, fuel efficiency, and maintenance status.
Timely delivery, whether daily or weekly, is crucial to respond promptly to issues. Reports must balance detail with clarity.
Too much data can obscure priorities. Too little reduces usefulness.
Using visual elements from the KPI dashboard like gauges or heat maps increases report readability. Automated reporting tools embedded in fleet management software can customize delivery to individual fleet managers’ preferences.
This ensures they receive relevant information without delays. It supports efficient fleet oversight and cost control.
learn more about fleet management dashboards